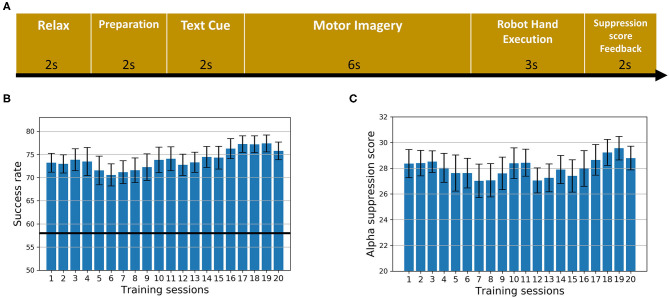
Figure 1.
The intervention. (A) The sequence of the training paradigm. (B) The average success rate of all training trials across 20 sessions for all subjects. Error bars stand for standard errors. The dark black line stands for the chance level. (C) The average α suppression score of all training trials across 20 sessions for all subjects. Error bars stand for standard errors.

