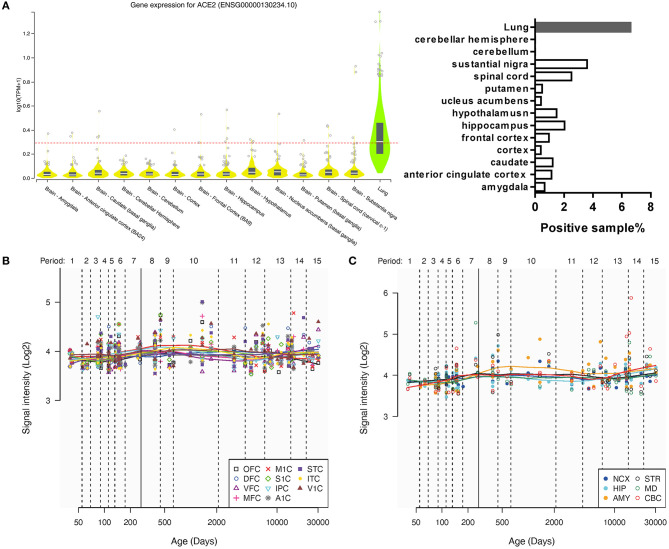
Figure 1.
The general expression of ACE2 in different human brain areas. (A) The expression of ACE2 in different human brain areas and the lung according to the GTEx Portal database (18). The dotted line means log10(CPM + 1) = 0.3, which means a threshold of the positive sample (>0.3 could be positive). (B,C) Change of intensity of ACE2 expression with age in different human brain areas according to the Human Brain Transcriptome database. Data are expressed as median, interquartile range (IQR), and all sample points in (A), whereas data are expressed as mean and all sample points in (B,C).

