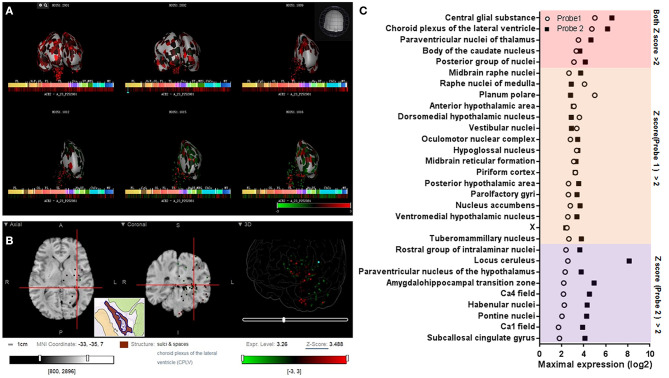
Figure 2.
Spatial distribution of ACE2 in the human brain according to the Allen Human Brain Atlas. (A) 3D view of the expression of ACE2 in different human brain areas based on the data of probe A_23_P252981 (probe 1). (B) Planar view of the expression of ACE2 in the choroid plexus of the lateral ventricle. The inset shows a sampled area of the choroid plexus of the lateral ventricle (the dark area in the inset). (C) Log2 intensity of ACE2 expression in the 30 brain areas with a z score >2.0 in at least one probe dataset (probe 1: A_23_P252981; probe 2: CUST_16267_PI416261804). All data were generated from the Allen Human Brain Atlas (http://human.brain-map.org/microarray/search). Images in (A,B) were directly from the Allen Human Brain Atlas (© 2010 Allen Institute for Brain Science, Allen Human Brain Atlas, available from: http://human.brain-map.org).

