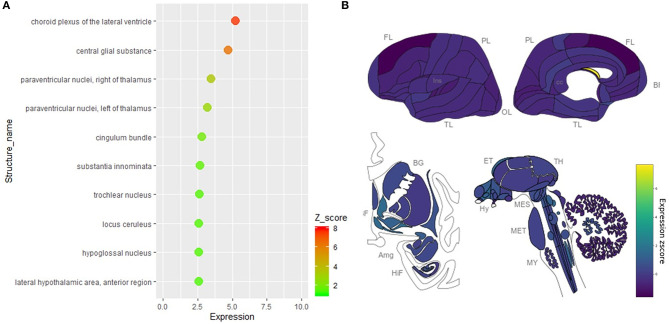
Figure 3.
Spatial distribution of ACE2 in the human brain according to the pooled data of the Allen Human Brain Atlas. (A) The expression intensity and z score of ACE2 in the top 10 brain areas of the pooled expression data of the two probes. (B) The distribution view of ACE2 expression in the human brain according to the pooled expression data of the two probes. Original data are available from the Allen Human Brain Atlas (http://human.brain-map.org/microarray/search). Brain region abbreviations: FL, frontal lobe; PL, parietal lobe; TL, temporal lobe; OL, occipital lobe; BF, basal forebrain; BG, basal ganglia; AmG, amygdala; HiF, hippocampal formation; EP, epithalamus; TH, thalamus; Hy, hypothalamus; MES, mesencephalon; MET, metencephalon; MY, myelencephalon.

