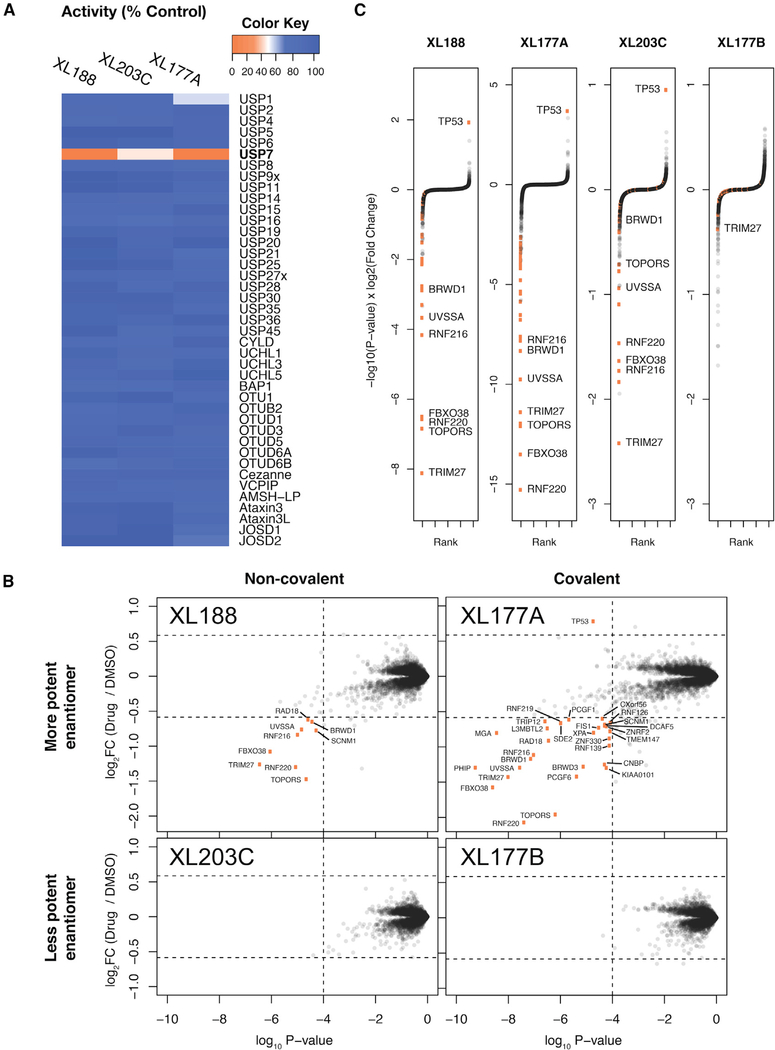
Figure 1. Differential Proteomics Analysis of MM.1S Cells Treated with Selective USP7 Inhibitors.
(A) In vitro biochemical selectivity of XL series USP7 inhibitors. Compounds XL188, XL203C, and XL177A were added to in vitro deubiquitination assays at concentrations of 10, 10, and 1 μM, respectively.
(B) Scatterplot representation of protein abundance changes after USP7 inhibitor treatment. Orange points represent proteins that pass the threshold of >1.5-fold change and p < 0.0001. p values and log2FC values were calculated using a moderated t test as implemented in limma. See Data S1 in the Supplemental Information for matching tables.
(C) Rank-order representation of protein abundance changes after USP7 inhibition. Proteins were ranked in ascending order using p value-adjusted log2 fold change as a score (Pi score = −log10(p value) × log2FC). Thresholds same as in (B).

