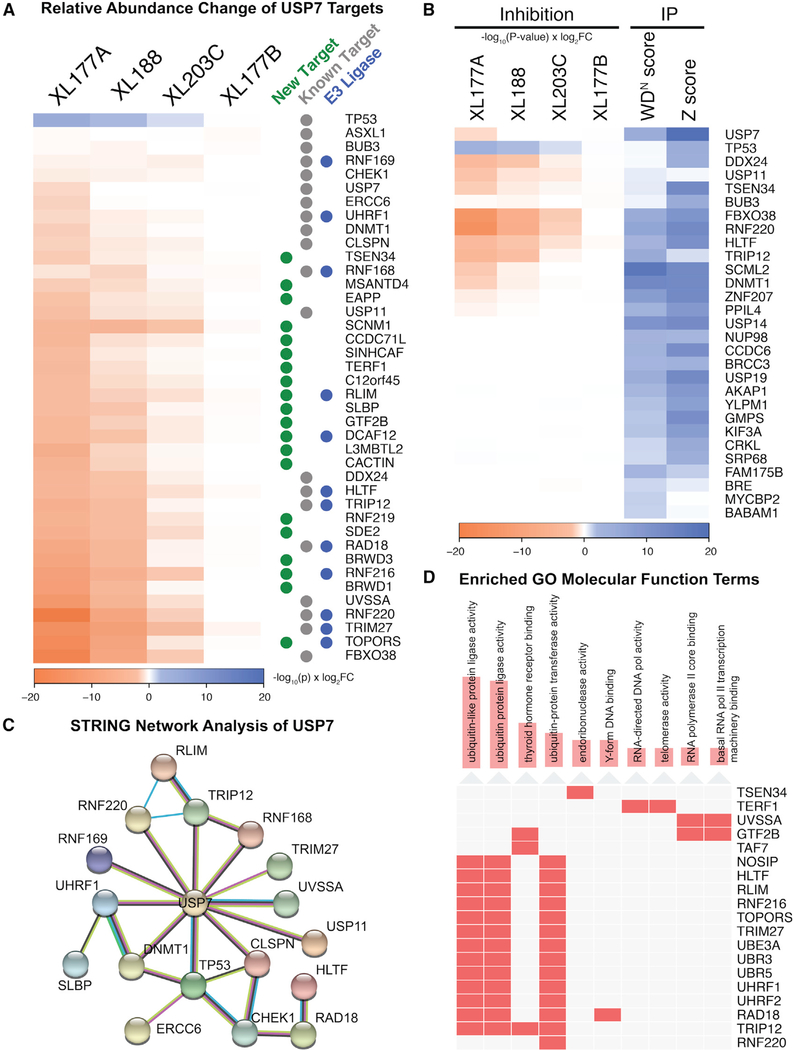
Figure 3. Evaluation of High-Confidence USP7 Candidate Substrates.
(A) Heatmap of Pi scores for top differentially quantified proteins and known USP7 targets (see Table S1) following USP7 inhibition.
(B) Heatmap comparison of USP7 inhibition against USP7 IP-MS data from the DUB Interactome database (see Figure S3A for Pearson correlation, Figure S3B for BioPlex database).
(C) STRING network analysis of proteins destabilized by XL177A and XL188 treatment (D) Annotation of USP7 targets with enriched Gene Ontology molecular function terms. Gene enrichment was calculated using Fisher’s exact test as implemented in Enrichr.

