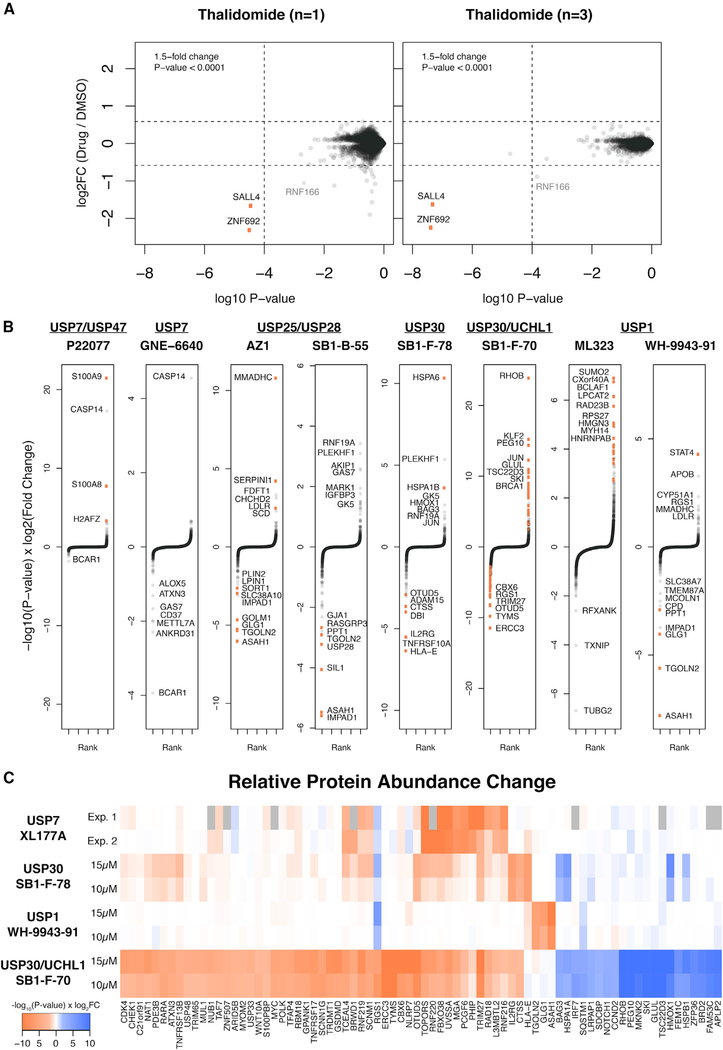
Figure 4. Differential Proteomics Analysis of Additional DUB Inhibitors.
(A) Comparison of singlicate (3× DMSO versus 1× Drug) and triplicate (3× DMSO versus 3× Drug) analysis of protein abundance changes after thalidomide treatment.
(B) Rank-order representation of differentially quantified proteins (as in Figure 1C) after singlicate cell treatments with various dual-selective DUB inhibitors. Thresholds same as Figures 1 and 2. See Data S1 and Data S2 in the Supplemental Information for matching tables and scatterplots.
(C) Heatmap comparison of proteins disrupted by DUB inhibition in two independent treatment doses or experiments.

