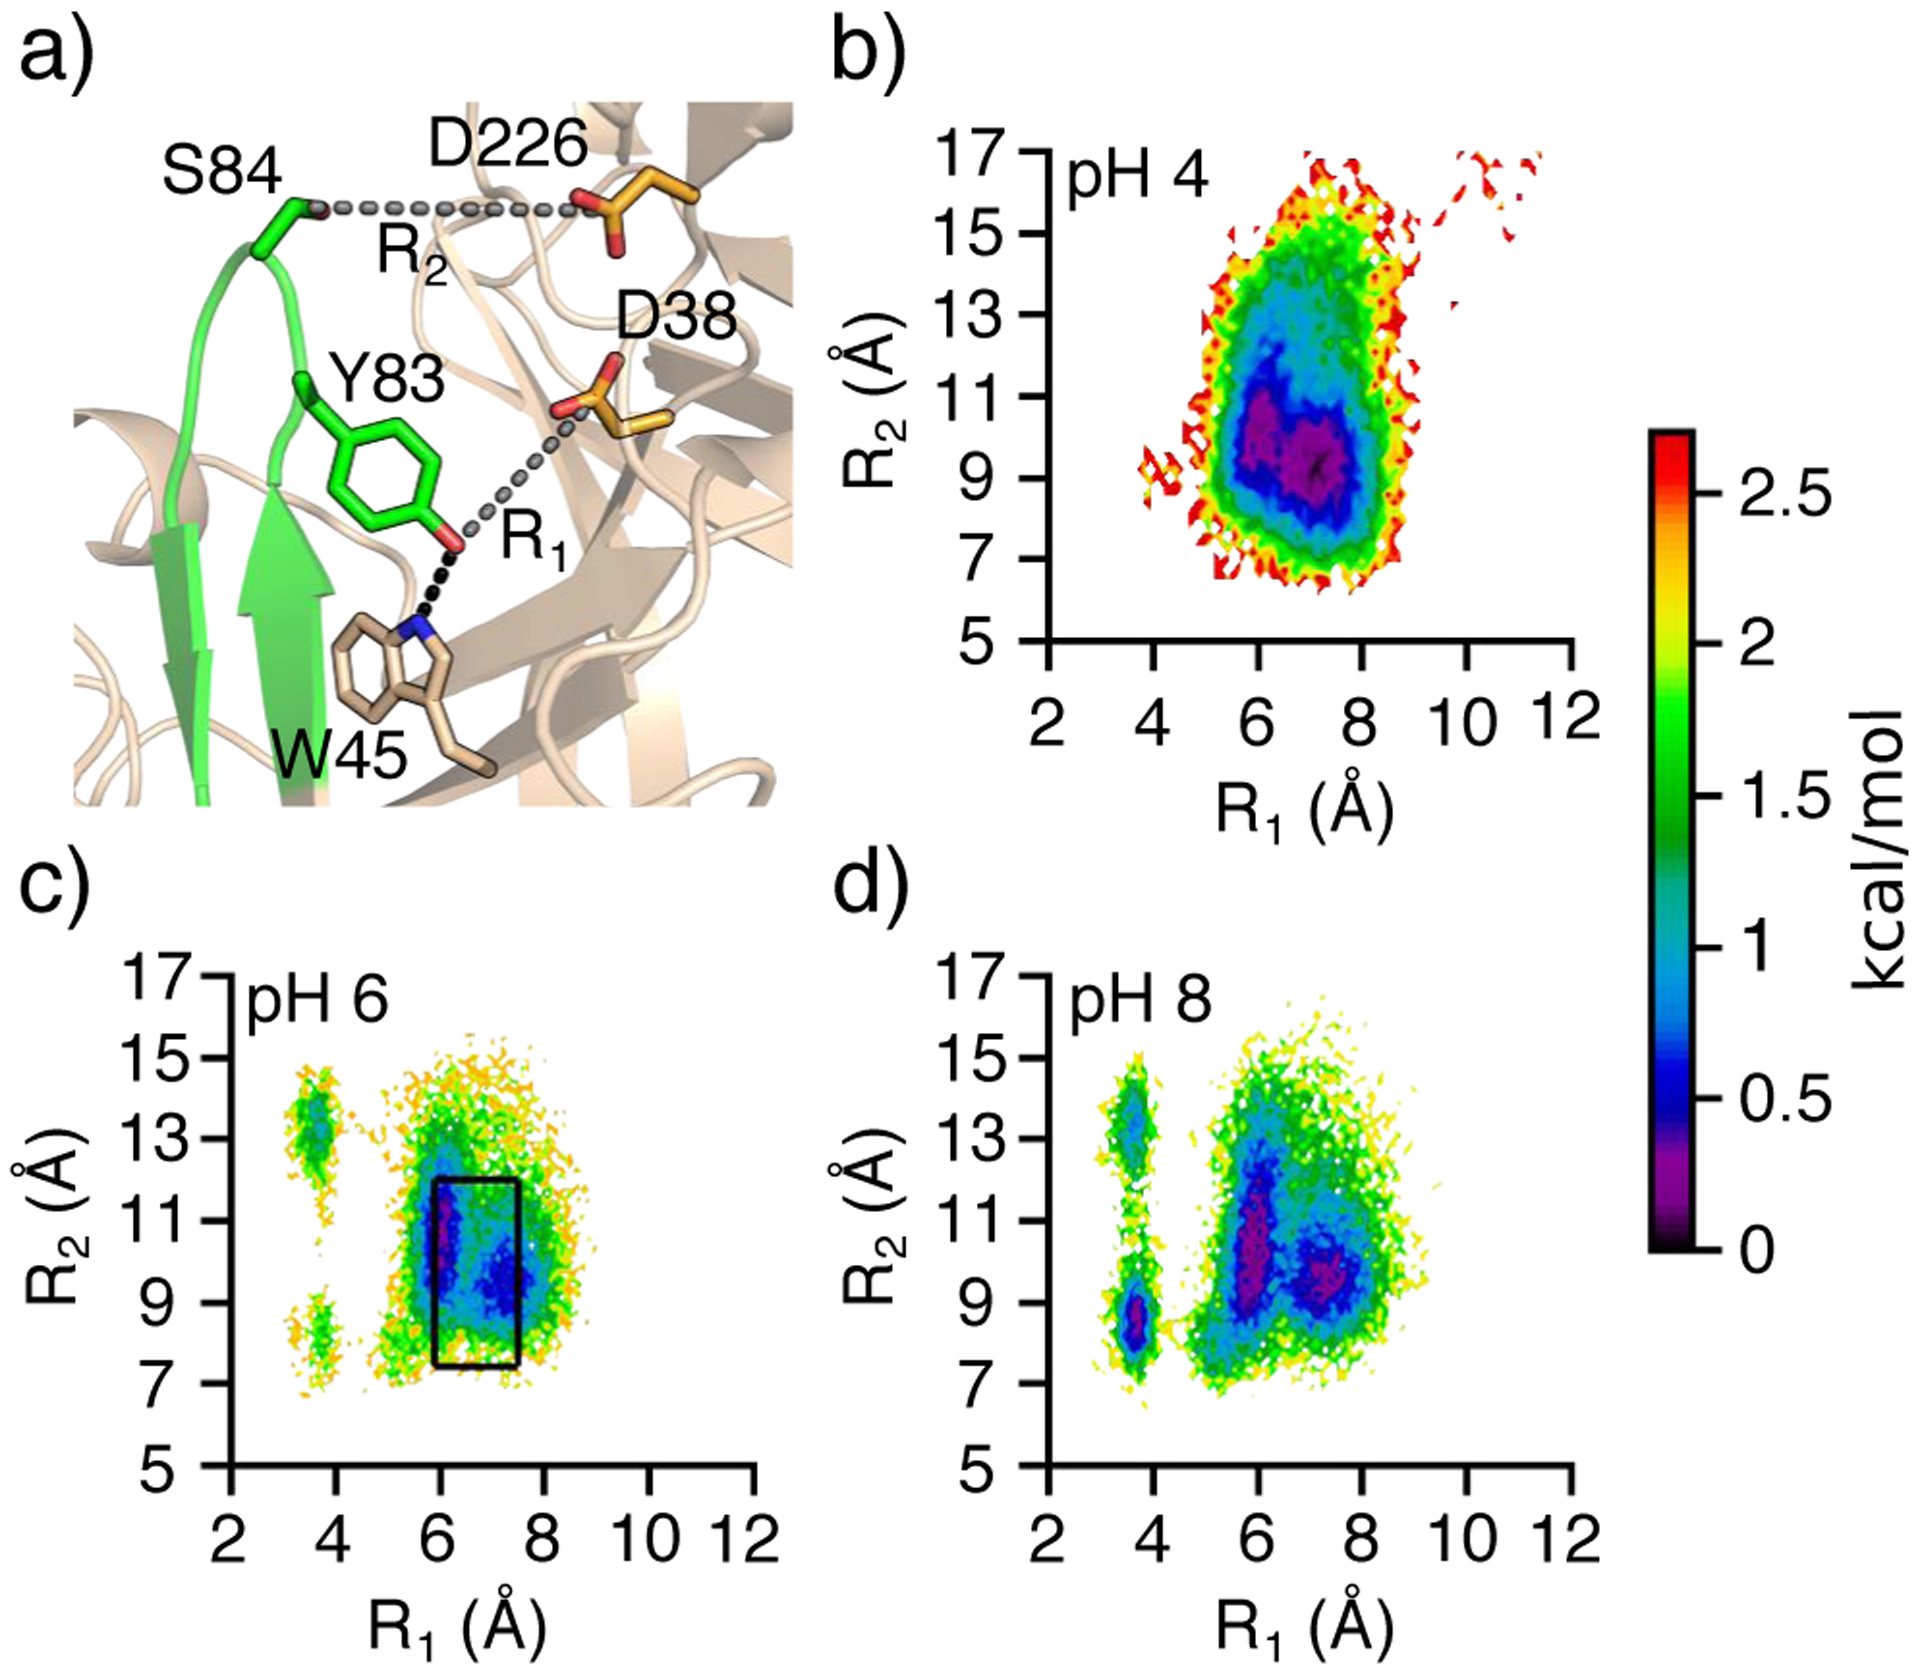
Figure 5. Conformational dynamics of the flap in renin.

a) Zoomed-in view of the flap region. The two distances used to calculate the free energy surface are indicated as grey dashed lines with the the hydrogen bond between Y83 and W45 being shown with a black dashed line. b–d) Free energy surface as a function of the distance between Tyr83:OH and Asp38:CG (R1) and the distance between Ser84:CB and Asp226:CG (R2) from the simulations at pH 4 (b), 6 (c), and 8 (d). The black box indicates the distances sampled by the majority of the crystal structures (see Figure S5). Data from the simulation run 1 was used. Free energy surface as a function of R1 and R2 was calculated and plotted using PyEMMA,36 which builds a two-dimensional histogram from the scatter data and plots −kTlnP(R1, R2), where P is the probability computed from the histogram count, k is the Boltzmann constant, and T is the temperature 298 K. 100 bins were used for each variable.
