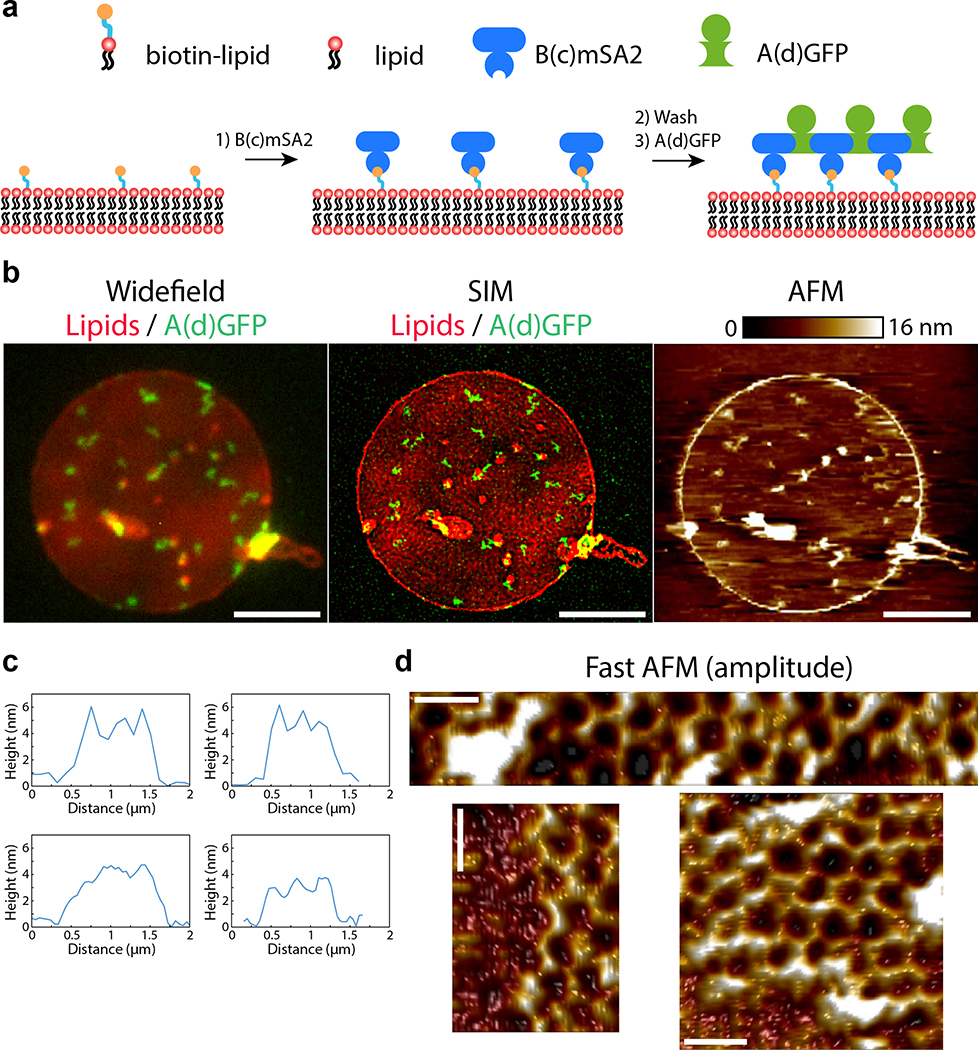
Extended Data Figure 9. Correlative SIM/AFM of arrays assembled onto supported bilayers.
(a) Design of the assay (see also methods): a supported lipid bilayer containing 5% biotinylated lipids and 0.2% fluorescent lipids is formed onto a glass coverslip in a flow cell. B(c)mSA2 (200 nM) is then injected into the chamber to bind to biotinylated lipids. After washing the excess of unbound B, A(d)gfp (20nM) is injected into the chamber. After assembly for 5 min, the chamber is extensively washed and the sample fixed. The top lid of the chamber is then removed, and the sample is imaged by Super-resolution structured illumination microscopy (SIM) imaging from the bottom and atomic force microscopy (AFM) from the top. This correlative imaging allows one to find the arrays by light microscopy, before increasing the magnification to determine their degree of order by AFM. Note that the sequential mode of assembly used here is conceptually identical to the assembly of arrays onto cells (Fig. 4). Indeed, the cyclic B component (B(c)) is used to anchor the array to the membrane via its monovalelent functionalization moiety (mSA2 here compared to GFP on cells), and assembly can only happen on the membrane, as there is no free B(c)mSA2 in solution. Accordingly, arrays assembled onto supported bilayers by this method are very similar to arrays assembled on cells when imaging with diffraction-limited microscopy (see b, left panel). (b) Low magnification image of arrays assembled as above obtained by correlative Widefield microscopy (left panel), SIM super resolution microscopy (middle panel) and AFM (right panel). Super-resolution imaging indicates that arrays appearing as diffraction-limited spots by widefield microscopy can actually be somewhat elongated structures. This is in remarkable agreement with our observation that arrays assembled on cell membranes can fuse post-assembly (Fig. 4b and Fig. 4c for quantification). This further confirms that assembly on supported bilayers and on cells are similar. (c) Examples of topography in the image presented in the b-right panel. Note that height measured by AFM is uniform at about 3–4 nm, confirming 2D growth. (d) High-magnification images of arrays seen in (c) by fast AFM, demonstrating high hexagonal order of the polymer onto supported bilayers (see methods; Note that the bottom right panel is identical to Fig. 4f, reproduced here for convenience). Lookup table corresponds to amplitude between 0 and 455, 475 and 410 pm for the top, bottom left and bottom right panels, respectively. From b-d, we conclude that the height and the size of the lattice on membranes is exactly as expected from the design model (Fig. 1), the EM imaging of arrays assembled in solution (Fig. 2a–c and Fig. Extended data Figure 8), the SAXS measurements of arrays assembled in solution (Fig. 2e and Extended data Figure 4) and the AFM measurements on mica substrates (Fig. 3 and Extended data Figure 5). This confirms that assembly on membranes leads to ordered arrays and also validates that our quantitative light microscopy measurements (Fig. Extended data Figure 10 and Fig. 4e) are a valid proxy for bulk order evaluation. Scale bars: 5 μm (b) 50 nm (d).

