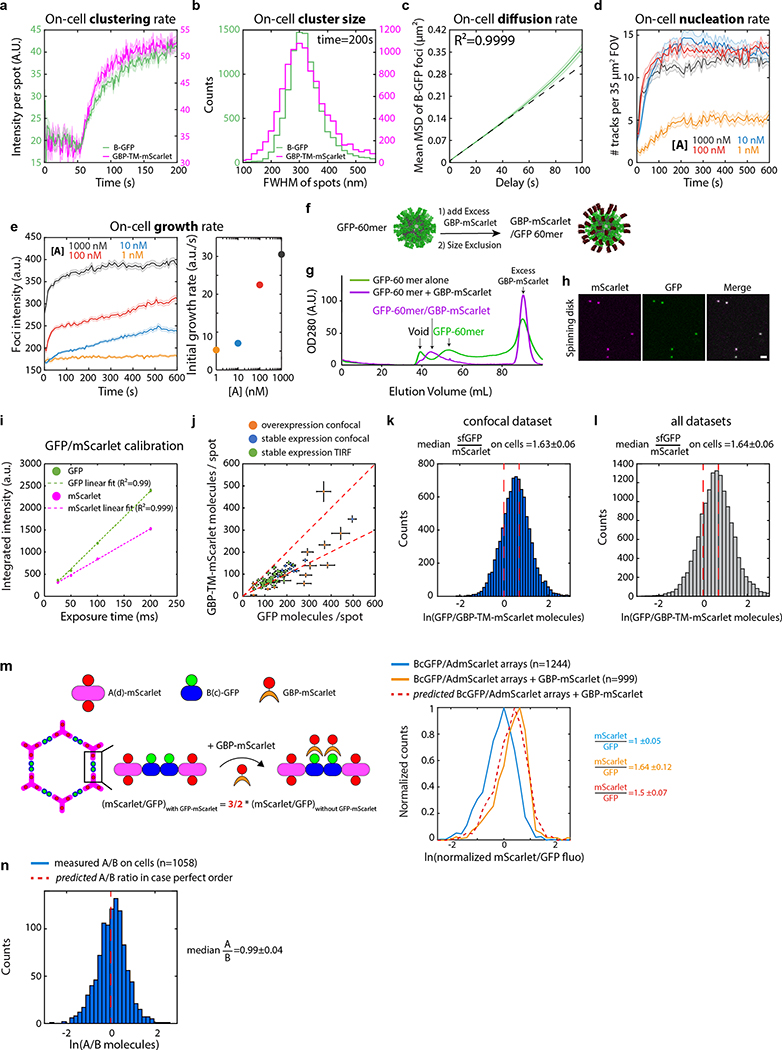
Extended Data Figure 10. Array dynamics and order in cell membranes.
(a-e) Automated quantification of array assembly on cells. (a) Stable NIH/3T3 cells constitutively expressing GBP-TM-mScarlet were incubated with 1μM B(c)gfp, rinsed in PBS, then 0.2μM unlabelled A was added and cells were imaged by spinning disk confocal microscopy. Upon addition of A, numerous foci positive for extracellular B(c)gfp and intracellular mScarlet appear, (see Figure 4b for representative images). (b) Size distribution (Full Width Half Maximum, FWHM) of the GFP- and mScarlet-positive spots generated in (a) at t=200sec imaged by TIRF microscopy (n=8972 arrays in N=50 cells). (c) Arrays assembled onto cells slowly diffuse at the cell surface. B(c)gfp foci at the cell surface were then automatically tracked, and the Weighted mean Square Displacement (MSD) was plotted as a function of delay time (Green solid line; n = 2195 tracks in N=3 cells, lighter area: SEM). Dashed black line: linear fit reflecting diffusion (R2=0.9999; Deff=0.0005 μm2/s). (d-e) NIH/3T3 cells constitutively expressing GBP-TM-mScarlet were incubated with 0.5 μM B(c)gfp, rinsed in PBS, then the indicated of unlabelled A was added and array dynamics was automatically measured by spinning disk confocal microscopy. (d) array nucleation rate per Field of View (FOV). (e) Middle panel: array intensity (equivalent to array size) over time (see methods; Mean+/−SEM). Right panel, initial growth rate of arrays as a function of the concentration of A. Number of FOVs analysed for left panel: 1 nM=16, 10 nM=14, 100 nM=18, 1000 nM=17; number of tracks analysed for middle and right panels: 1 nM=373, 10 nM=425, 100 nM= 599, 1000 nM= 639). Increasing the concentration of A leads to an increase of both the nucleation rate and the initial growth rate. However, higher concentrations of A led to a faster drop in the growth rate, most likely due to the saturation of all B components by A components. The inflection in the 100nM and 1000nM curves corresponds to the transition from array growth to array fusion (see also Fig. 4b, c, Extended data Figure 11j), which is less clear at 10nM. Note that the final intensity of the arrays (i.e. their size) depends on the concentration of A. (f-i) Establishment of a 1:1 GFP/mScarlet calibration standard. (f) Purified GFP-60mer nanocages were mixed with an excess of purified GBP-mScarlet, then submitted size exclusion chromatography to isolate GFP-60mer nanocages saturated with GBP-mScarlet. (g) Chromatogram comparing the size exclusion profile of either the GFP-60mer alone, or the GFP-60mer +GBP-mScarlet mix. The high molecular weight peak of assembled 60-mer nanocages is further shifted to high molecular weight due to the extra GBP-mscarlet molecules, but is still not overlapping with the void of the column. (h) Spinning disk confocal imaging of GFP/GBP-mScarlet nanocages purified as in (g) onto a glass coverslip. Fluorescence is homogenous and there is perfect colocalization between the GFP and mscarlet channels Scale bar: 1 μm. (i) Mean+/−SEM fluorescence in both GFP and mScarlet channels of GFP/GBP-mScarlet nanocages as a function of microscope exposure time, showing that the instrument operates in its linear range ( number of particles analysed: 25ms: n=167; 50ms n=616; 100ms: n=707 and 200ms: n=1086). Similar results were obtained for TIRF microscopy. Exposure for all calibrated experiments in this paper is 50ms. Note that the variant of GFP used throughout the paper, on both B and the nanocages is sfGFP (referred to as GFP for simplicity). (j-l) The clustering ability of arrays scales with array size and does not depend on the microscopy technique used. To explore a wide range of expression levels of GBP-TM-mScarlet, we measured the average number of GFP and mScarlet molecules per array in NIH/3T3 cells expressing GBP-TM-mScarlet either stably or transiently, leading occasionally to some highly overexpressing cells. To verify that our evaluation of the clustering efficiency, that is the GFP/mScarlet ratio, was not affected by the microscopy technique, we imaged cells with two calibrated microscopes (Total Internal Reflection Fluorescence (TIRF) microscopy and Spinning disk confocal (SDC) microscopy). As can be seen in j, all cells fall along the same line, suggesting a similar GFP/mScarlet ratio independently on the expression level or the microscopy technique. (overexpression imaged by spinning disk (SDC): n=12 cells; overexpression imaged by TIRF: n=15 cells; stable expression imaged by TIRF: n=50 cells, this last dataset corresponds to Fig. 4d, reproduced here for convenience). (k-l) Histogram of the GFP/mScarlet ratio (in molecules) by pooling for all cells in the TIRF dataset (k; n=8972 arrays in N=50 cells; corresponds to Fig. 4d), or for all dataset pooled (l; n=14074 arrays in N=77 cells). Dash red lines: theoretical boundary GFP/mScarlet ratios for either a 1:1 B(c)GFP : GBP-TM-mScarlet ratio, in case both GFPs of the B(c)gfp dimer are bound to GBP, or a 2:1 ratio, in case only one GFP of the B(c)gfp dimer is bound to GBP. Irrespective of the technique used, the median GFP/mScarlet ratio at 1.64(m) left: Principle of the experiment: preformed B(c)gfp/A(d)mScarlet arrays are incubated with or without a two-fold molar excess of GBP-mScarlet over B(c)gfp prior to centrifugation to remove unassembled components and excess GBP-mScarlet, and their fluorescence analyzed by spinning disk confocal microscopy. Right panel: histogram of mScarlet/GFP fluorescence intensity ratio for the indicated arrays, normalized by the median ratio of the sample without GBP-mScarlet. The fluorescence ratio increases by the amount predicted by the structure, suggesting that the fluorescence ratio is a bona fide proxy for bulk order. See also Fig. Extended data Figure 8d for EM verification of the order of B(c)gfp/A(d)mScarlet arrays. (n) Evaluation of the A/B ratio in terms of molecules in arrays assembled on cells with Bgfp and AmScarlet taking into account FRET between GFP and mScarlet (see methods; n=1058 arrays in N=12 cells). The ratio is nearly identical to the ideal 1:1 ratio suggesting that arrays made on cells have the same level of order as those made in vitro.

