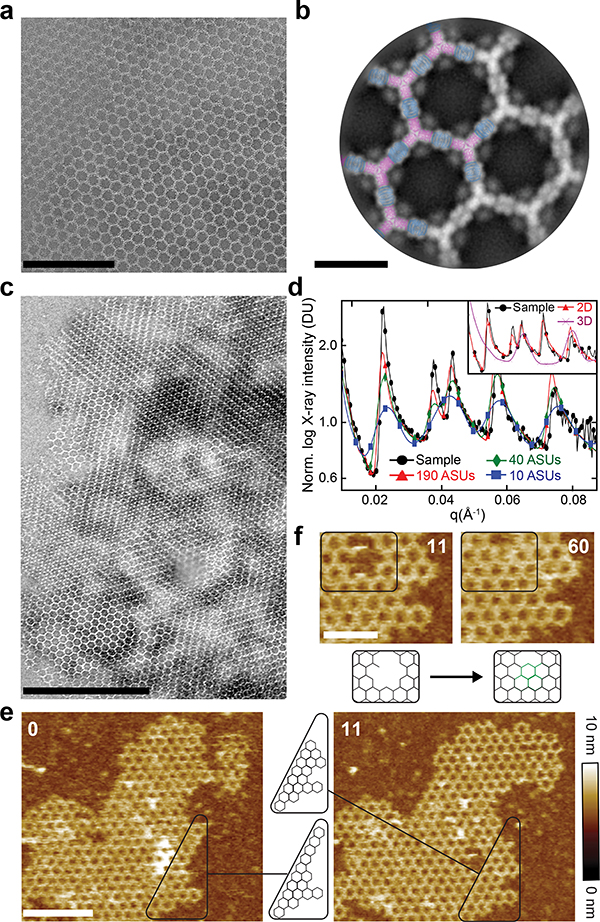
Figure 2. Structure of in vitro assembled arrays.
(a) Negative stain TEM of monolayered Agfp+B array. (b) Computational model (A - magenta, B - blue) overlayed on averaging of (a) (gray), GFP density is evident near A. (c) Negative Stain EM of micron-scale arrays. (d) SAXS profile of overnight assembly of A and B (black) versus calculated profiles from atomic models of various sheet dimensions have near identical peaks spacing and positions. Inset: SAXS profiles for the measured sample (black), 2D (red) and 3D (magenta) models. (e) AFM imaging of array growth on mica showing assembly (black box) spanning a number of unit cells. (f) Close up of (e) showing healing of lattice vacancy defects (black box). Elapsed time: minutes. Scale bars: (a) 200 nm; (b) 20 nm; (c) 500nm; (e) 200 nm; (f) 200 nm.

