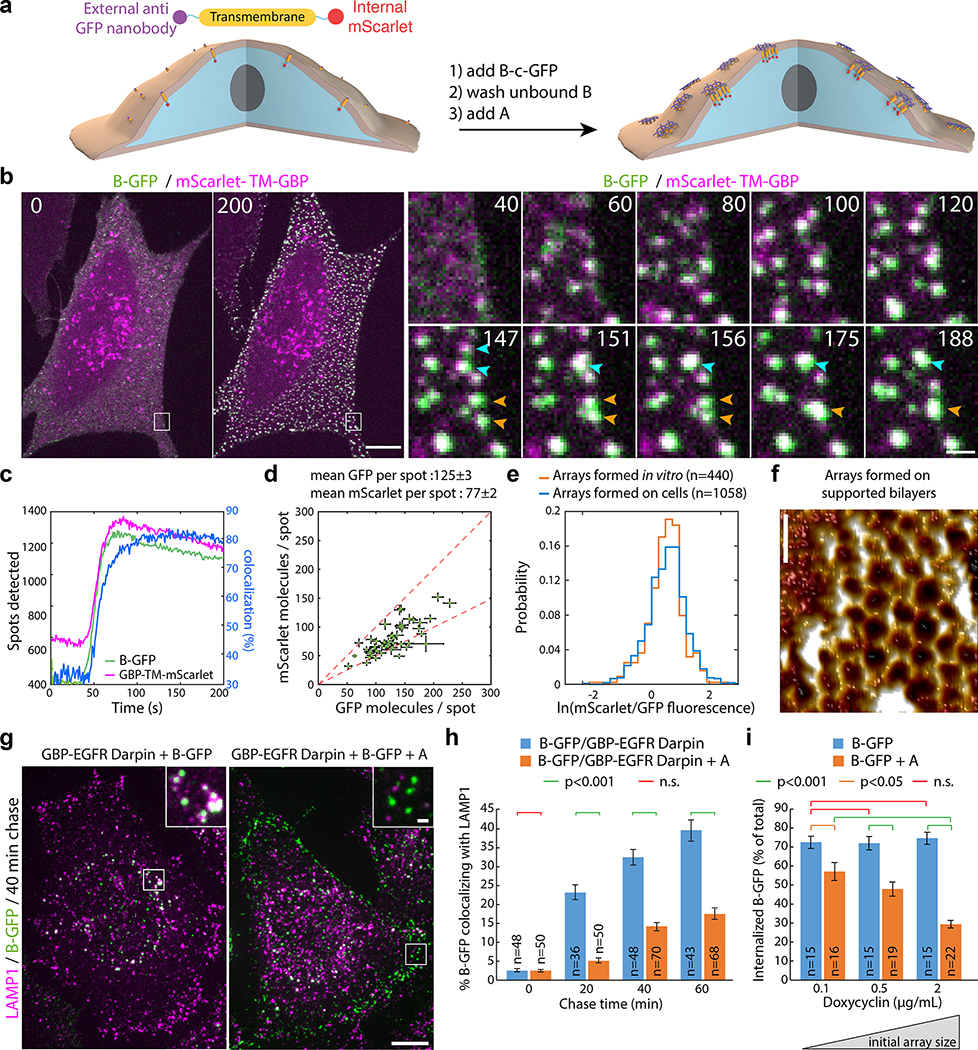
Figure 4. Large arrays assembled on cells block endocytosis.
(a) GBP-TM-mScarlet-expressing 3T3 cells were incubated with B(c)gfp then A and imaged by confocal microscopy. (b) Upon addition of A, foci positive for B(c)gfp / mScarlet appear, which eventually fuse (arrows). (c) Quantification of effects seen in (b). (d) Number of GFP and mScarlet molecules per array plotted per cell (mean±SEM; n=8972 arrays in N=50 cells). Dash red: boundary ratios for 1:1 or 2:1 B(c)gfp/GBP-TM-mScarlet ratio, depending on the number of GBP-TM-mScarlet bound per B(c)gfp dimer. (e) mScarlet/GFP fluorescence intensity ratio histograms of B(c)gfp/A(d)mScarlet arrays, either preformed or assembled on cells (n=1058 arrays in N=12 cells / n=440 preformed arrays). (f) AFM imaging of arrays assembled as in (a), but on supported bilayers. Lookup table corresponds to [0–410] pm amplitude. (g) EGF receptors (EGFR) on HeLa cells were clustered using A, B(c)gfp, and GBP-EGFR-Darpin, a fusion binding both GFP and EGFR. After 40min, cells were processed for LAMP1 immunofluorescence and confocal imaging (maximum-intensity z-projections; insets: single planes). (h) Quantification of the effects seen in (g)(n: number of cells). Statistics: ANOVA1 (p<0.001) followed by Tukey test. (o) 3T3 cells expressing GBP-TM-mScarlet under Doxycyclin control were treated with increasing doses of Doxycyclin to control the initial size of arrays, then treated as in (a) and internalization was quantified after 60 min. Statistics: ANOVA1 (p<0.001) followed by Tukey test. Scale bar: 10 μm (b-left, g), 1 μm (b-right, g inset) and 50 nm (k).

