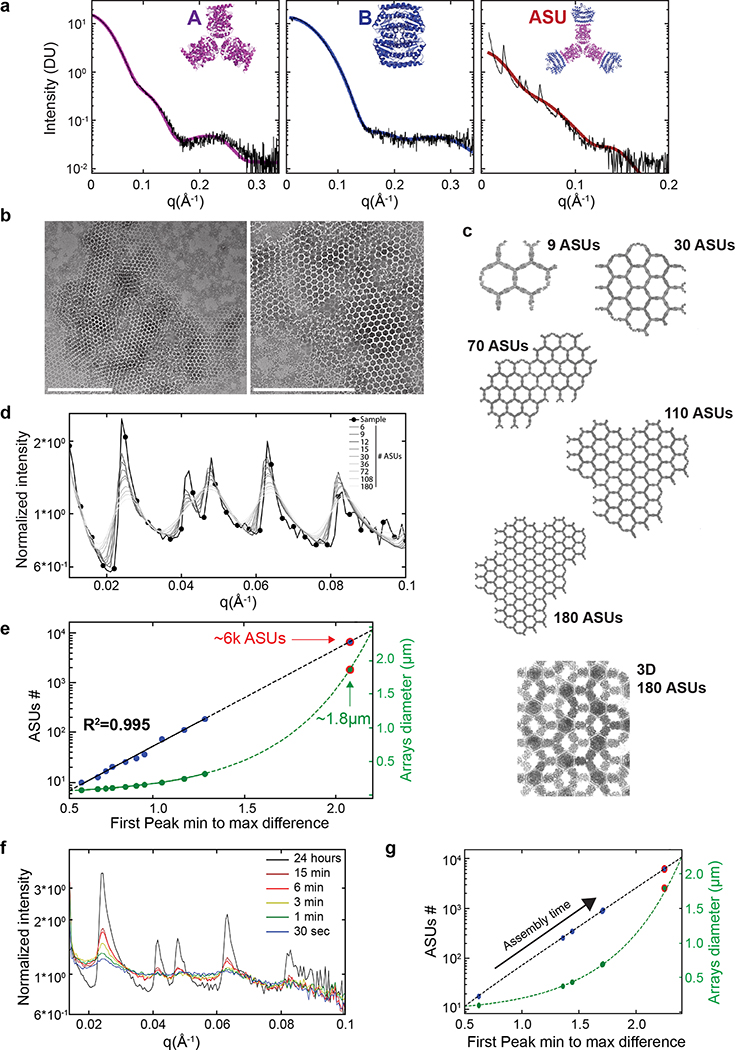
Extended Data Figure 4. SAXS analysis.
a) Left and middle panels: Components A and B SAXS measurements (black curves) analyzed using the Scatter program and SAXS profiles (magenta and blue for components A and B model (shown in insets), respectively) calculated using FOXS (Schneidman-Duhovny, D., Hammel, M., Tainer, J. A. & Sali, A. FoXS, FoXSDock and MultiFoXS: Single-state and multi-state structural modeling of proteins and their complexes based on SAXS profiles. Nucleic Acids Res. 44, W424–W429 (2016)) and demonstrating excellent agreement (A: χ2=0.18, B: χ2=0.20) and no concentration dependence. Right panel: A+B mixture SAXS measurement (black curves) and ASU scattering profile (brown). Bragg peaks shown in the A+B SAXS data correlate with the p6 symmetry model and spacing of 303 Angstrom (see Table S8) in close agreement with TEM data and design model. The ASU model (top right panel corner) comprises 12 monomers, 6 belonging to a single A component (D3 hexamer in magenta) and 6 more belonging to 3 halves of the B component (half of a D2 tetramer in blue). b) Negative stain TEM assembly validation for the components used for the SAXS experiments demonstrating the local expected order. c) Array models with increasing size, increasing number of ASUs, and 3D crystal model of stacked arrays as inferred from TEM analysis shown in Extended data Figure 3d. Scattering profiles of array models consisting of an increasing number of ASUs ([6, 9, 12, 15, 30, 36, 72, 108, 180] gray scale intensity corresponds to ASUs #) and selected models are shown in (c). A+B mixture SAXS measurement profile (as shown in (a) right panel) is shown as a black curve and circle markers demonstrating close agreement between the computational design model of the p6 array and structures formed in solution. e) Interpolation of measured arrays ASUs number and dimensions (assuming circular arrays) based on the fit to the models’ SAXS profiles intensity difference between the first peak minimum and maximum (see method) suggesting that in solution (unsupported) the two components form 2D arrays which constitute about 6,000 ASUs (tera-Da scale flat assembly) and are 1.8 μm in diameter. f) SAXS profiles collected directly following the mixture of array components at time points ranging from 30 sec to 15 min. Each measurement was collected from a separate well to avoid accumulated damage to the samples. It is notable that within the first 30 seconds following components mixture at 10μM, distinctive Bragg peaks emerge. Based on the computational model analysis (panels (e) and (g)) these newly formed arrays constitute only a few hexagons; however, this suggests that SAXS measurements enable a thorough kinetics study and construction of phase diagrams of macroscale 2D binary systems. Scale bars: (b) 500 nm

