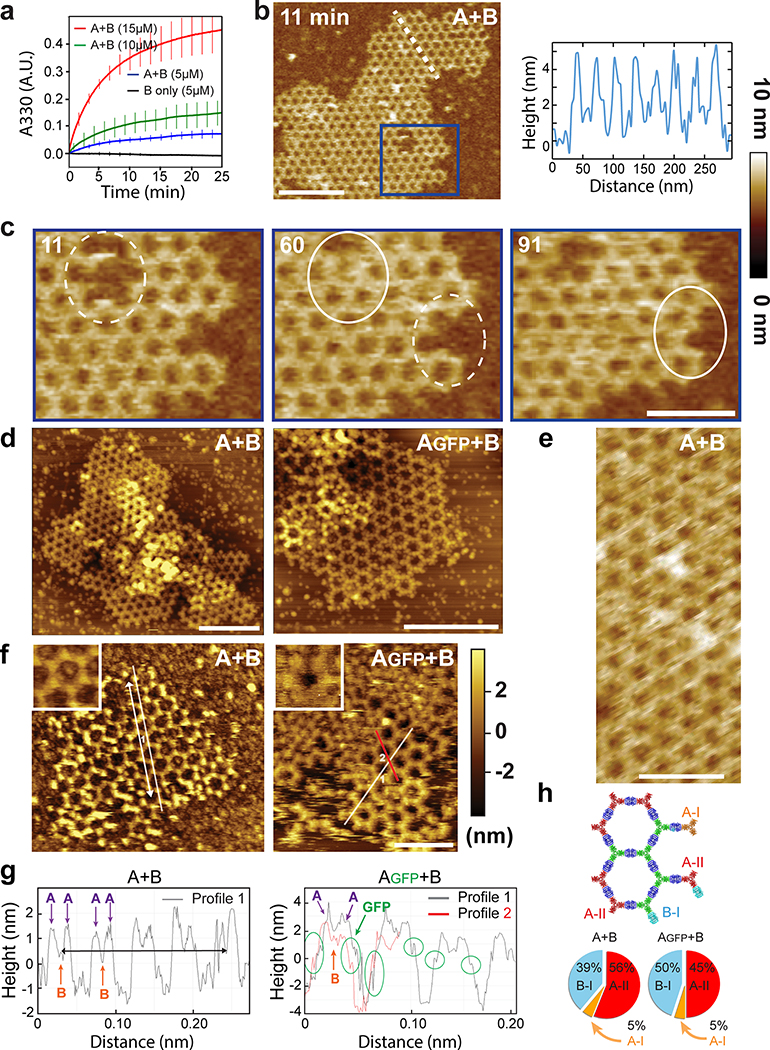
Extended Data Figure 5. In vitro assembly kinetics and AFM edge analysis.
(a) Kinetics of array formation in solution monitored by light scattering, (mean ± SD; n=3 experimental replicates; see methods for details). (b-h) AFM characterization of arrays on freshly cleaved mica substrates in fluid cell from a solution containing components at equimolar concentrations of 7μM. Arrays were assembled from A+B components or Agfp+B as indicated. (b) Left panel: height section profile along the white dashed line of an AFM image of growing A+B arrays (right panel). Note that this picture is the same as the one in Fig. 2e, reproduced here for convenience. (c) Close up of the area in blue in (b) showing healing of lattice vacancy defects and growth (dashed to solid white circles). Elapsed time in minutes. Note that the left and middle pictures are the same as the ones in Fig. 2f, reproduced here for convenience. (d) Structural comparison of A+B arrays (left panel) and Agfp+B arrays (right panel). To extract the unit cell length, we further processed five images of arrays assembled from A+B components and fives images of arrays assembled from Agfp+B components. Five pixels width gaussian blur filter was applied to smooth the images (low pass filter) and a cross section along the crystal lattice direction was used to assess the length of every five unit cells. A+B and Agfp+B arrays unit cell length and standard deviation are calculated to be 31.51 ± 0.41nm (n=14) and 31.57 ± 0.53nm (n=20), respectively. (e) High magnification detail of a A+B array. (f-g) Edge analysis based on our ability to characterize edge states. By comparing arrays formed from A+B components (left panels) vs. arrays formed from Agfp+B components (right panel). By analysing the profile along crystal lattice directions (indicated with white lines in (f) and as the white or red curves in (g) a measurable signal for the GFP fusions or the lack of it, can be measured. Lattice edge state analysis for the co-assembly of Agfp units and B units assume the images capture equilibrium distributions of edge sites and are based on ΔG(i - j) = -kTln(pi/pj). We assume equilibrium states because assembly kinetics is significantly faster (see panel a and Extended Data Figures 4f,g) than the experimental setup. This is further supported by the set of images in fig. 2e–f and panel c above where we follow the dynamics of a single array at time points ranging from “zero” to 91 minutes which demonstrate mostly defects healing, and reshaping. For the edge state statistics we analysed 9 and 2 images for the A+B pair in liquid and air, respectively, and 6 and 3 images for the Agfp+B pair in liquid and air, respectively. The calculated free energy differences between different edge states: ΔG(AGFP-II - AGFP-I) = −5.5 kJ/mol, ΔG(B-1 - AGFP-I) = −5.2 kJ/mol, and ΔG(AGFP-II - B) = −0.3 kJ/mol. Unit cell spacing, the distance between the centers of each two hexagons, is calculated by measuring the distance over a number of unit cells (white arrow in (f left panel) corresponding to the black arrow in (g left panel)). The arrow length is estimated at 215nm and unit cell spacing at 315Å (see methods) in close agreement with the design model 310Å). (h) Lattice edge state statistics. Scales bar: (b,d) 200nm, (c,e-f) 100nm

