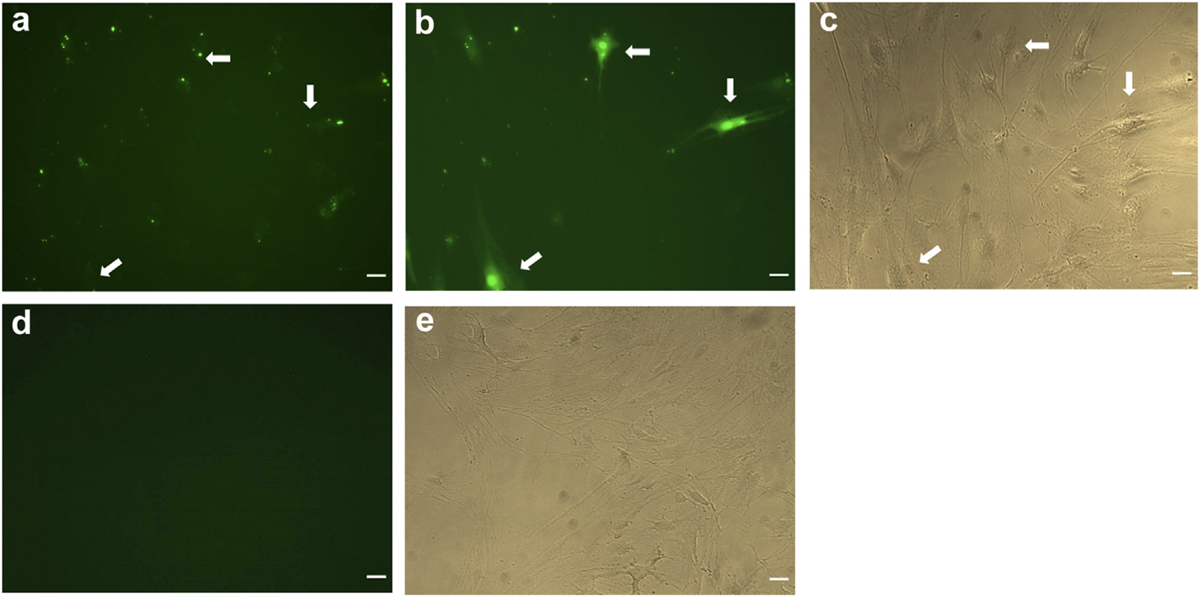
Fig. 4.

Time course images show uptake and distribution of Fl-L57 in BMVECs. Representative images of live cells incubated with Fl-L57 at 10 µM over the first 1 min of incubation (panels a–c) and vehicle (panels d–e). a. Image of cell culture well immediately after adding Fl-L57. b. Visualization of Fl-L57 in the same well at 1 min after exposure shows uptake by BMVECs. c. Phase contrast image of the same cells in a-b. Supplementary Time-Lapse Videos (V1 and V2) show the dynamics of peptide uptake in cells. d. BMVECs without peptide. e. Phase contrast image of the same cells shown in d. Scale bar represents 30 µm.
