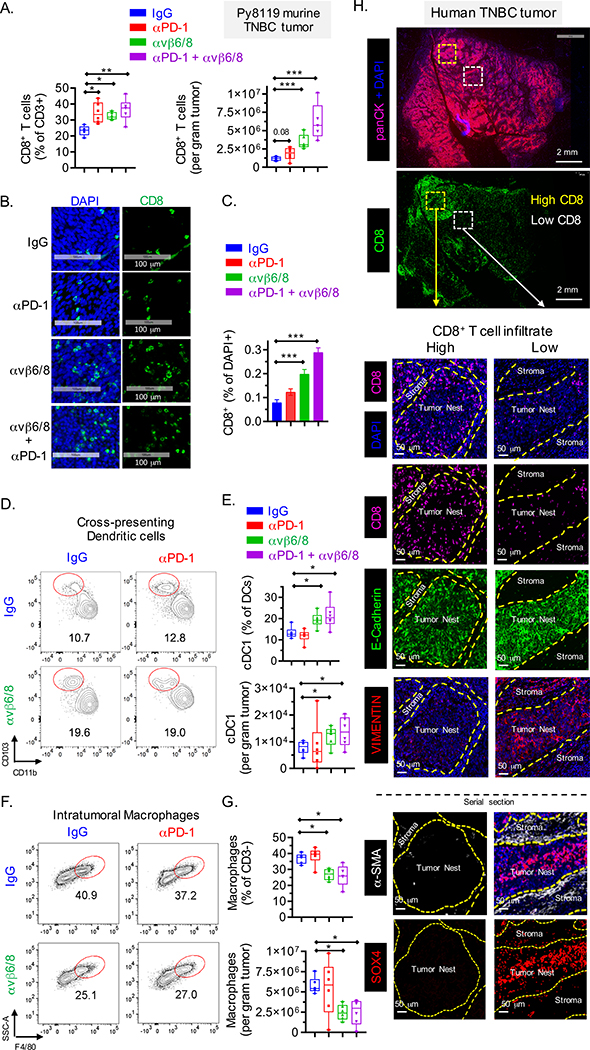
Fig. 4. Analysis of tumor microenvironment in murine and human TNBC.
(A) Quantification of tumor infiltrating CD8+ T cells, represented as percentage of CD3+ cells (left) and per gram of tumor (right) in Py8119 TNBC tumors (n=6) treated with indicated mAbs (FACS analysis 22 days following tumor inoculation). (B-C) Representative images showing CD8+ T cell infiltration into Py8119 TNBC tumors (n=6) (B) and quantification of CD8+ cells as percentage of DAPI+ cells (C). (D-E) Contour plot showing migratory cross-presenting DCs, defined as CD45+/CD3−/F4/80−/CD11c+/MHC-IIhigh/CD103+/CD11b− cells (D) and quantification of these cells as percentage of DCs (CD45+/CD3−/F4/80−/CD11c+/MHC-IIhigh) and total count (E). (F-G) Contour plot showing intra-tumoral F4/80+ macrophages, defined as CD45+/CD3−/Gr1−/CD11b+/MHC-II+/F4/80+ cells (F) and quantification of these cells as percentage of CD45+ CD3− cells (top) and per gram of tumor (bottom) (G). (H) Human TNBC tumor sections stained with indicated markers. Serial sections were stained with DAPI and antibodies specific for CD8, E-cadherin and vimentin (panel #1) and DAPI, SOX4 and αSMA (panel #2). Data are summarized as mean ± SD. Data in [B, C] is an average of two independent experiments and data in [A, D, E, F and G] are representative of at least two independent experiments. For box plots, dots denote all individual values, horizontal lines denote median values, boxes extend from 25th - 75th percentile of each group’s distribution, and no data points were excluded. An unpaired Student’s t-test was used to determine statistical significance, ***P < 0.001; **P < 0.01; *P < 0.05. See also Figure S4 and S5.

