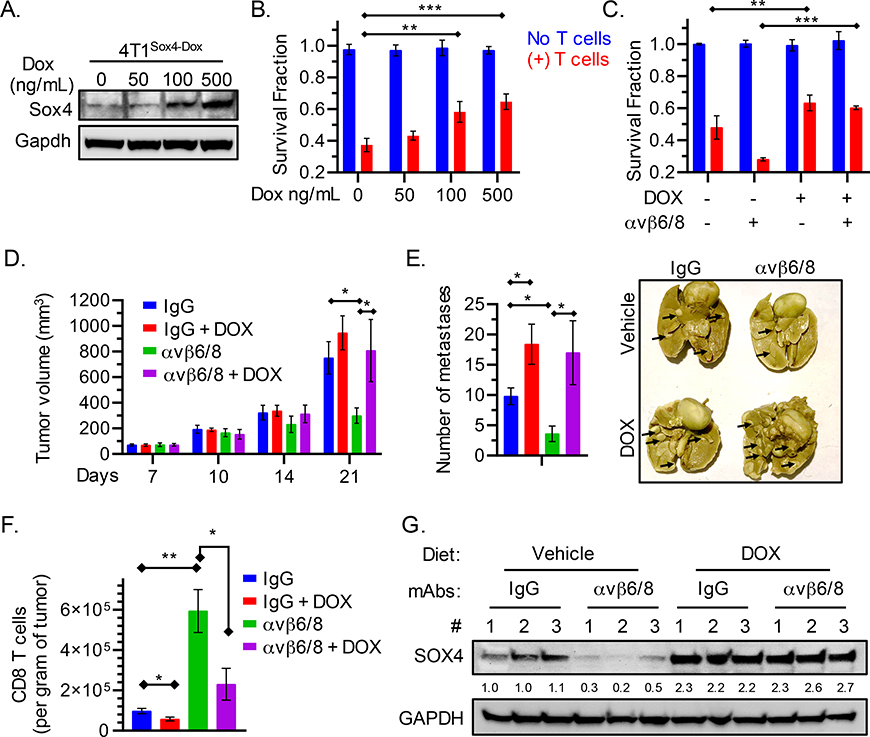
Fig. 5. Relevance of SOX4 to the efficacy of integrin αvβ6/8 mAb treatment.
(A) Immunoblot showing levels of SOX4 and GAPDH proteins in GFP+ 4T1 murine TNBC cells containing a doxycycline (DOX) inducible Sox4 cDNA construct (4T1Sox4-Dox). Cells were treated with the indicated concentrations of doxycycline for 48 h. (B) Cells from (A) were co-cultured with murine GFP-specific CD8+ T cells (red) (E:T = 1:1), and the fraction of surviving cells was quantified (Y-axis) after 24 h of co-culture. (C) 4T1Sox4-Dox tumor cells were treated with either DOX (500 ng/mL) alone or in combination with integrin αvβ6/8 mAb for 48 h followed by co-culture with murine GFP specific CD8+ T cells (red) for 18 h. (D) 4T1Sox4-Dox TNBC (n=10 mice/group) primary tumor volume shown at indicated time points. Mice with similar tumor burden were fed either a regular diet or a doxycycline-containing diet (625 ppm, Envigo Teklad) starting on day 7 to induce the expression of SOX4 in tumor cells. Mice receiving either diet also received monotherapy with integrin αvβ6/8 or isotype control mAbs (IP, 0.25 mg/dose, twice weekly) until tumor volume in any group reached 1000 mm3. Data are summarized as mean ± SD of tumor volume. (E) Number of lung surface metastases in mice treated as described in (D) following staining with picric acid for 24 h. Summary of number of lung surface metastases (left) and representative images (right) on day 21 following tumor inoculation. (F) Quantification of tumor-infiltrating CD8+ T cells per gram of tumor (right) following treatment as described in (D) on day 21 following tumor inoculation. (G) Immunoblot showing levels of SOX4 and GAPDH proteins in 4T1Sox4-Dox tumors (n=3 per group) derived from mice treated as described in (D) on day 21. Numbers represent relative quantification of SOX4 to GAPDH, normalized to the average expression in vehicle and IgG treated controls. Data in [A, B, C and G] are representative of at least two independent experiments with technical triplicates and summarized as mean ± SEM [B, C]. Data in [D, E, F] are an average of two independent experiments and summarized as mean ± SD. To determine statistical significance, a one way ANOVA with Dunnett’s [B-E] post hoc test or an unpaired Student t-test [F] was used. ***P < 0.001; **P < 0.01; *P < 0.05; n.s., not significant.

