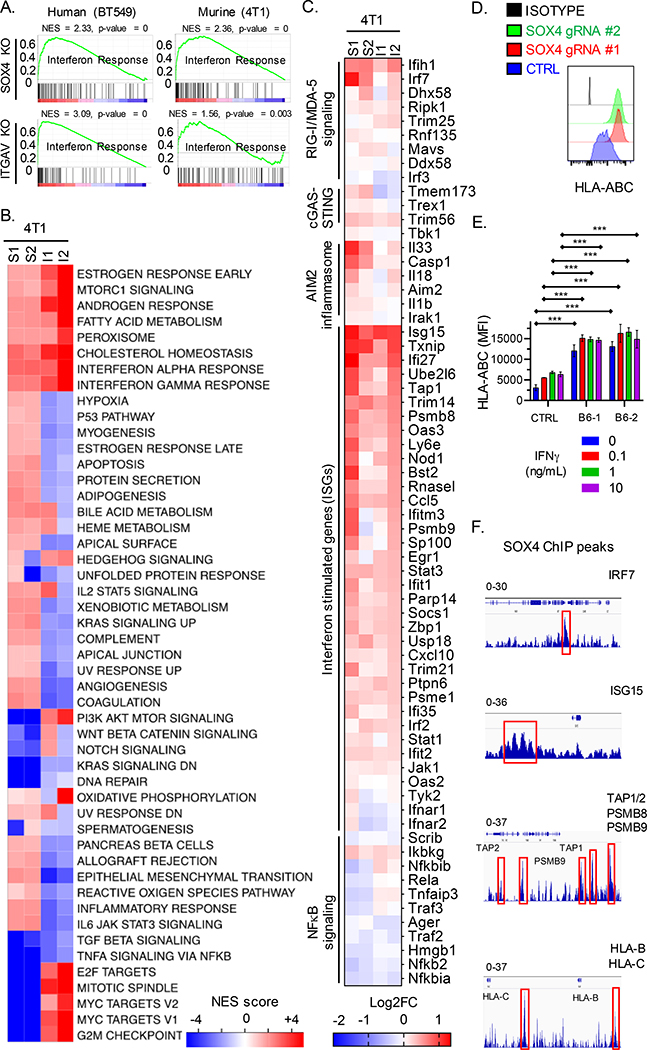
Fig. 6. SOX4 regulates multiple innate and adaptive immune genes to inhibit T cell-mediated tumor immunity.
(A) GSEA analysis for gene sets associated with an interferon response in human (BT549, left) and murine (4T1, right) TNBC cells edited with SOX4 (top) or ITGAV (bottom) gRNAs compared to control edited cells. (B) GSEA results are summarized as the normalized enrichment score (NES) in Sox4 (S1, S2) or Itgav (I1, I2) deficient 4T1 TNBC cells as compared to control edited counterparts. (C) Heat map showing RNA-seq data for indicated genes from 4T1 TNBC cells edited with either two Sox4 (S1, S2) or two Itgav (I1, I2) gRNAs. Gene expression is shown relative to control edited 4T1 cells (log2FC, color scale). (D) Surface HLA-ABC protein levels on BT549 cells edited with two different SOX4 gRNAs or a control gRNA (CTRL); isotype control antibody staining is shown in black. (E) Surface HLA-ABC protein levels on BT549 cells edited with two different ITGB6 (B6–1, B6–2) or control gRNAs, followed by stimulation with indicated concentrations of IFNγ for 24 h. (F) ChIP-seq with SOX4 mAb in human BT549 TNBC cells. SOX4 specific peaks (red boxes) at the indicated gene loci relative to reference genome Hg19 analyzed using the IGV viewer (IGV, Broad Institute). The data range is shown on top for each indicated gene. Data in [A-C] represent an average of triplicates of two independent gRNAs for each gene knockout. Data in [D, E] are representative of at least two independent experiments with technical triplicates. Data in [F] was assessed using biological triplicates each composed of technical duplicates. A two-way ANOVA with Dunnett’s post hoc test was used to determine significance in [D and E]. Data are summarized as mean ± S.E.M, *** P < 0.001; **P < 0.01; *P < 0.05; n.s., not significant. See also Figure S6, Table S1, and S2.

