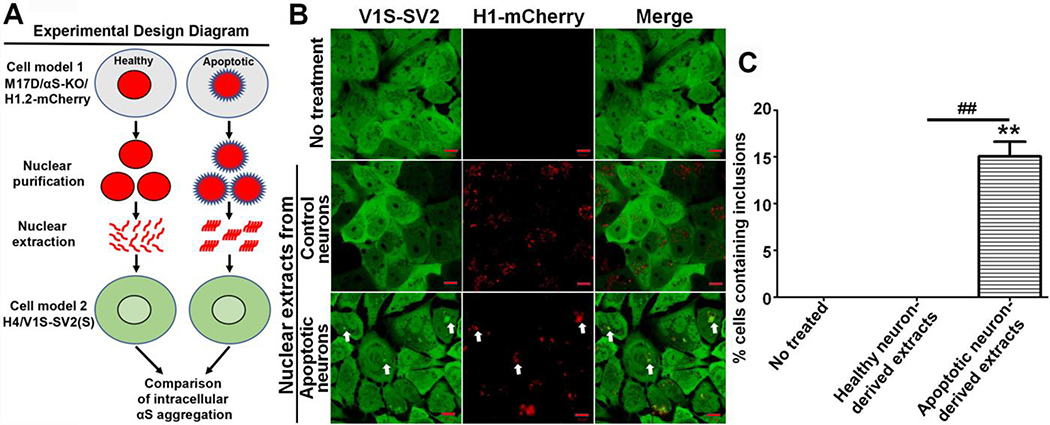
Fig. 1. Apoptotic neuron-derived nuclear extracts induce αS aggregation upon cellular uptake.
A) Experimental design diagram. B) M17D/αS-KO/H1-mCherry cells (M17D cells with αS knockout and expression of mCherry-tagged histone H1) were differentiated for 7 days then subjected to MPTP to induce apoptosis (apoptotic neurons) or vehicle (control neurons) for 2 days followed by purification of nuclear extracts, which were subsequently added to H4/V1S-SV2 cells for 3 days. H4/V1S-SV2 cells without any treatment were used as another negative control. White arrows denote internalized H1-mCherry-labeled nuclear extract and its-associated αS inclusion. αS-KO: αS knockout; H1-mCherry: mCherry tagged histone H1; H4/V1S-SV2: a H4 neuroglioma cell line co-expressing the N-terminal half of Venus YFP tagged αS (V1S) and C-terminal half of Venus YFP tagged αS (SV2) for visualization of αS aggregation. C) Bar graph shows the comparison of the 3 groups, with ratio of cells with inclusions to total cells. Error bars represent standard error of the mean (*p < 0.05, **p < 0.01, comparing subsets linked by line, n = 3).

