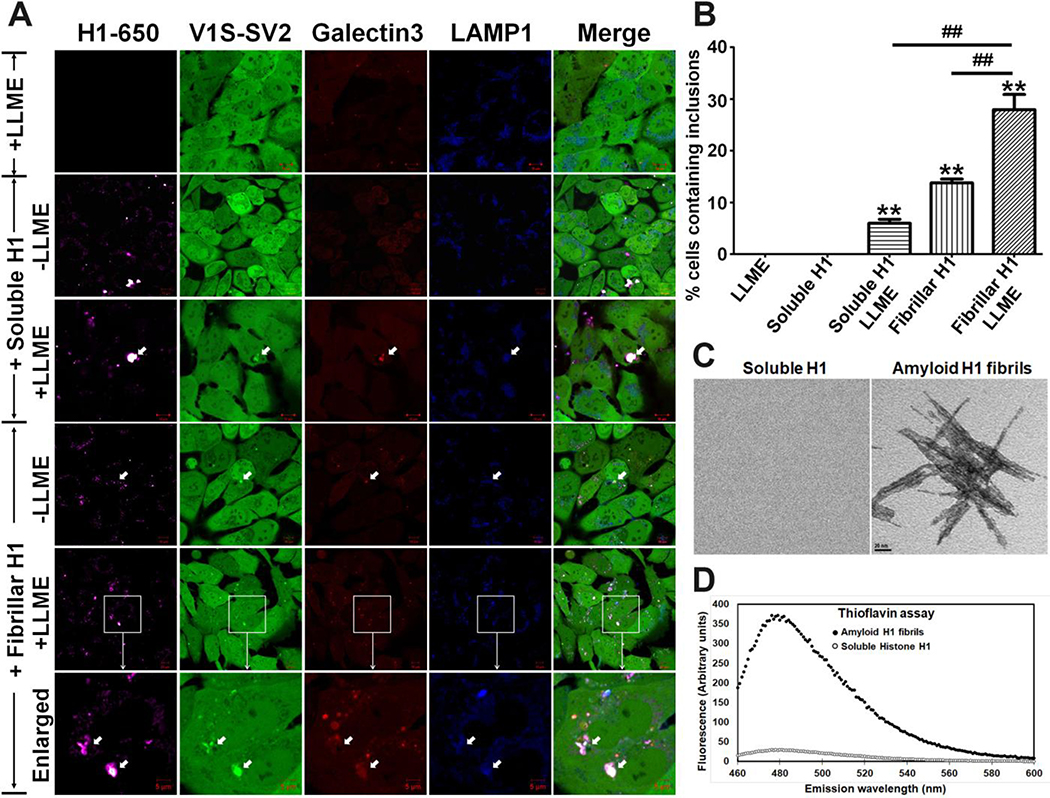
Fig. 3. Amyloid fibrillar, but not soluble, histones induce intracellular αS aggregation upon internalization into recipient cells.
H4/V1S-SV2(S)/LAMP1-eCFP/mCherry-Galectin-3 cells were treated with the same amount of soluble recombinant histone H1 and histone H1 amyloid fibrils, respectively. After 3 days of treatment, sibling cultures of each group were exposed to 1 mM LLME for 1–2 hours. In parallel, a group of cells without histone, but with LLME treatment for the same time, were used as a control. (A) Cells in the individual groups were imaged under confocal microscope to detected intracellular αS inclusions; (B) Bar graph shows the comparison among different groups for the ratio of cells with inclusions to total cells. Error bars represent standard error of the mean (*p < 0.05, **p < 0.01, comparing subsets linked by line, n = 3). (C) & (D) For confirmation of histone H1 amyloid fibrils, samples were subjected to negative staining to demonstrate amyloid filaments with EM (C). Thioflavin T assay was also used to measure formation of beta-sheet structure (D). The same concentration of soluble histone H1 solution was used as a negative control. Scale bar in (C): 20 nm.

