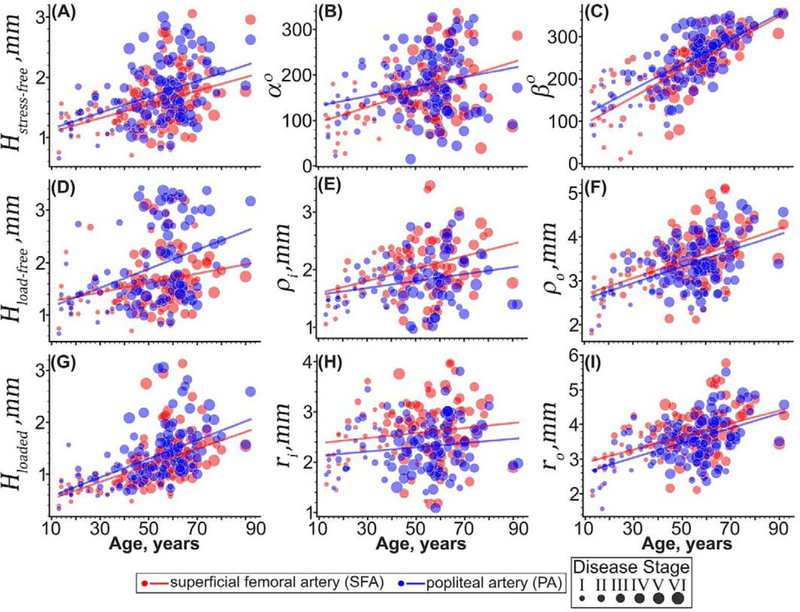
Figure 7:
Morphometric characteristics of the superficial femoral (SFA, red) and popliteal (PA, blue) arteries plotted versus age. Panels include arterial wall thickness in the (A) stress-free (H) load-free, and (G) loaded configurations; (B) circumferential (α) and (C) longitudinal (β) opening angles; load-free (E) inner and (F) outer radii; and loaded (H) inner and (I) outer radii. The size of the dots represents the disease stage of each specimen, with larger dots indicating more disease. Lines are linear regression fits to the experimental data.

