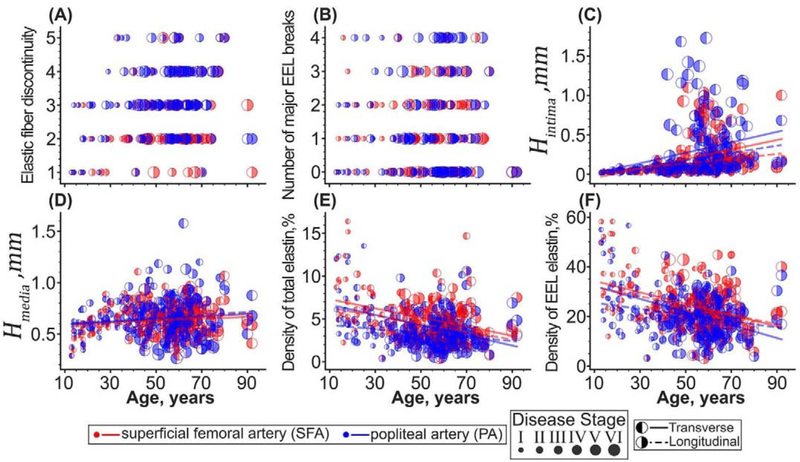
Figure 8:
Changes with age in (A) the discontinuity of elastic fibers in the EEL, (B) the number of major EEL breaks, (C) thickness of the tunica intima, (D) thickness of the tunica media, (E) density of the total elastin, and (F) density of elastin in the EEL of the SFA (red) and PA (blue) measured using transverse (left-filled dots) and longitudinal (right-filled dots) sections. The size of the dots represents the disease stage with larger circles corresponding to a more advanced disease stage. Lines are linear regression fits to the experimental data.

