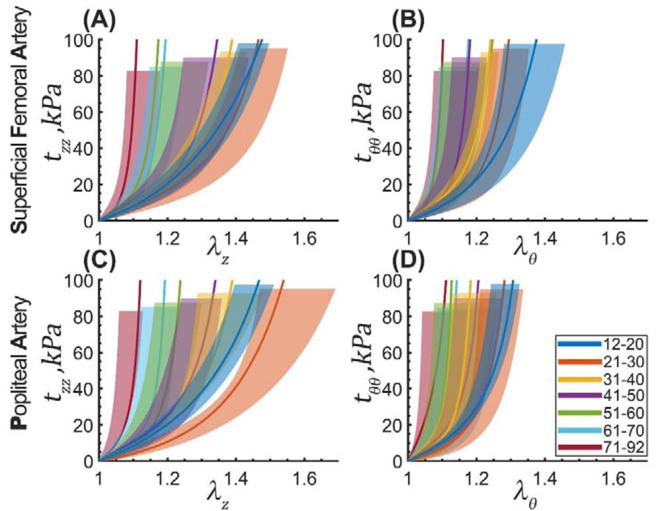
Figure 9:
Median equibiaxial stress-stretch curves for the SFA (top) and PA (bottom) separated into 7 decadal age groups. Panels (A) and (C) plot longitudinal stretch versus longitudinal Cauchy stress, and panels (B) and (D) report circumferential stretch versus circumferential Cauchy stress. Legend summarizes the range of ages for each group (years). Variability within each age group is demonstrated by the shaded semi-transparent regions that bound 25th and 75th percentile ranges. They have different heights for better visualization.

