Figure 3.
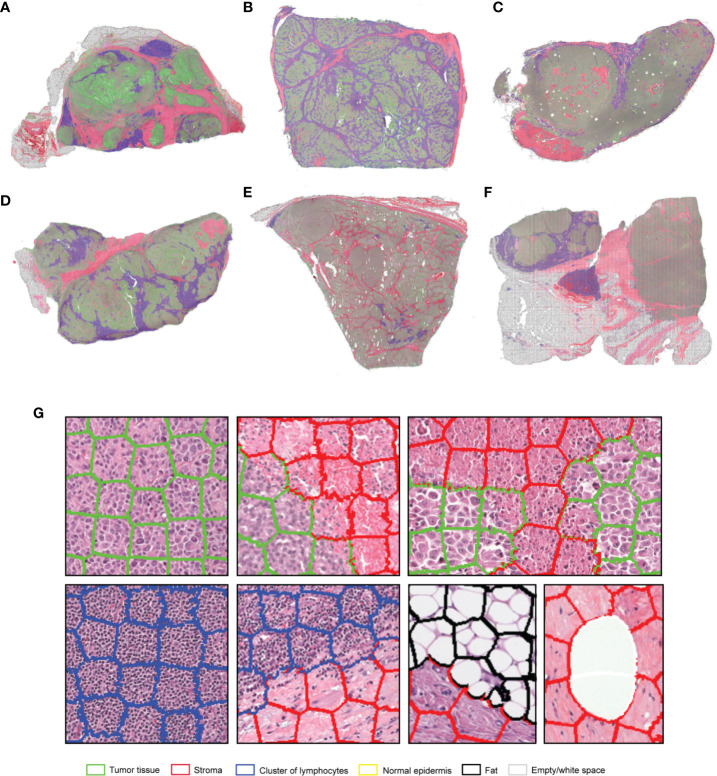
(A–F) Representative examples of the results obtained from the application of the SuperHistopath pipeline in whole-slide images of tumors (5x) of the Cancer Genome Atlas (TCGA) melanoma dataset [(G) Magnified regions of interest]. Note the important clinically-relevant phenotypes characterized by clusters of lymphocytes infiltrating the tumor in samples (B, D). or the majority of clusters of lymphocytes residing just outside the tumor area (left and central part) with only a few clusters infiltrating the tumor (right part) in sample (C).

