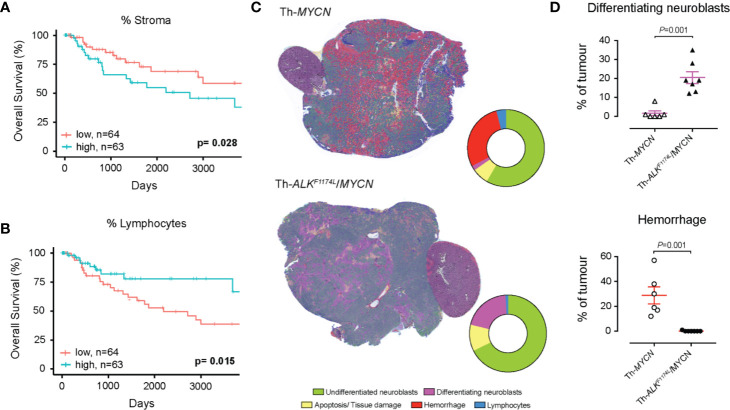
Figure 6.
Quantification of clinically relevant features with SuperHistopath. (A, B) show associations between survival outcomes and SuperHistopath-defined risk groups in the Cancer Genome Atlas (TCGA) cohorts of patients with melanoma. (A) Kaplan-Meier Survival curves for patients in the high-risk group (blue) and low risk group (red) classified by stromal cells ratio derived from SuperHistopath and (B) Kaplan-Meier Survival curves for patients in the high-risk group (blue) and low risk group (red) classified by immune infiltrate based on lymphocytes cluster ratio derived from SuperHistopath. (C, D) show the SuperHistopath-based quantification of tumor phenotype in genetically-engineered mouse model of high-risk neuroblastoma. (C) Representative SuperHistopath-segmented whole-slide images (5x) and pie chart showing the Super-CNN quantified mean composition of the tumors arising in Th-MYCN (n=6) and Th-ALKF1174L/MYCN (n=7) mouse models of high-risk neuroblastoma. Note the marked difference of phenotype induced by the expression of the ALKF1174L mutation characterized by (D) a significantly increased neuroblastoma differentiation neuroblasts and the total abrogation of the characteristic hemorrhagic phenotype of Th-MYCN tumors.

