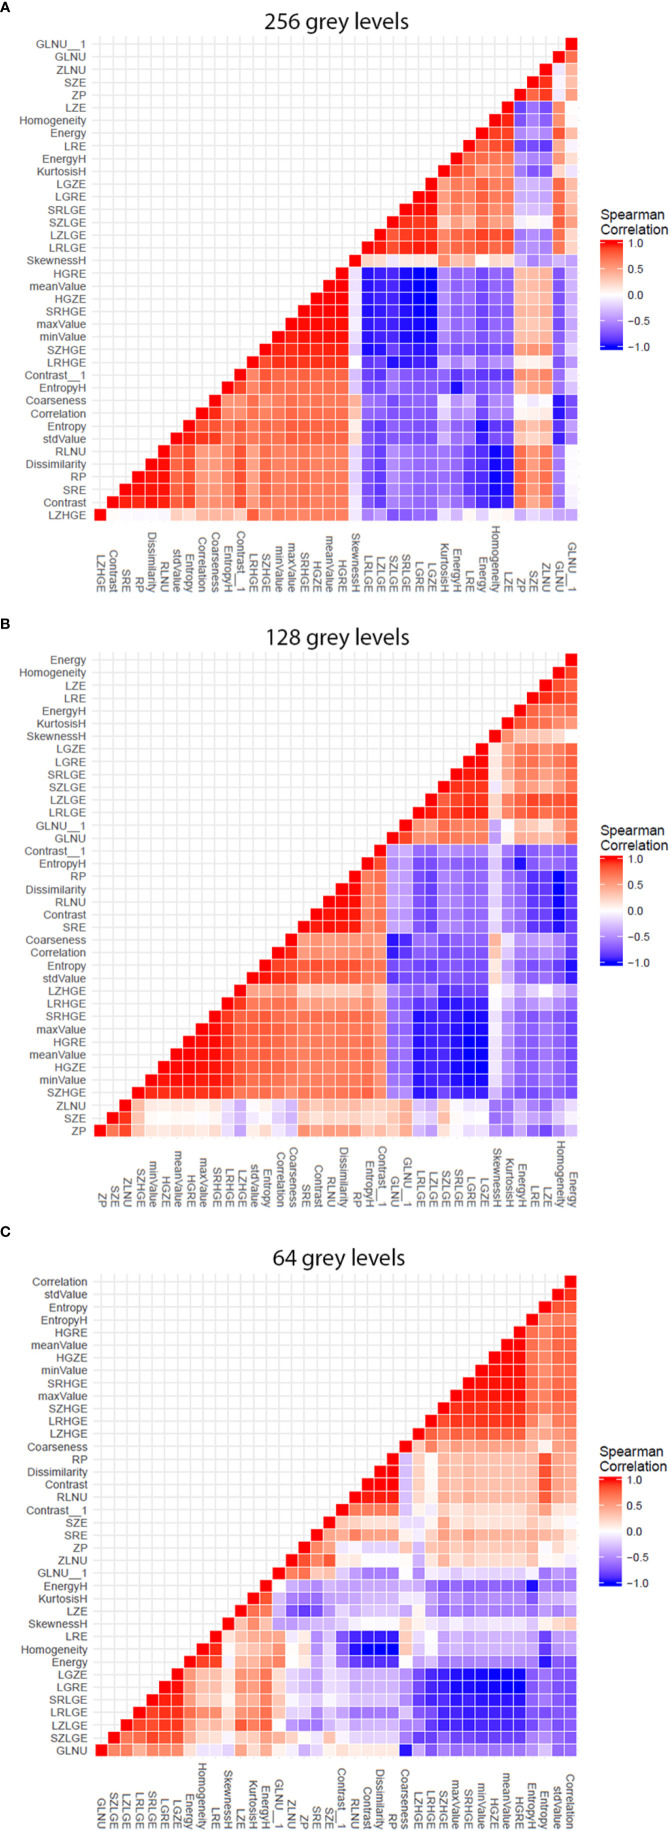
Figure 2.
Graphs showing influence of software resampling step on phantom study. Each graph representes the two-by-two coefficient correlation calculation between the texture parameters at one resampling level. The difference in resulting patterns shows the influence of the software resampling step on texture parameters calculation, particularly on parameters extracted from co occurrence matrix. (A) 256 gray levels resampling. (B) 128 gray levels resampling. (C) 64 gray levels resampling.

