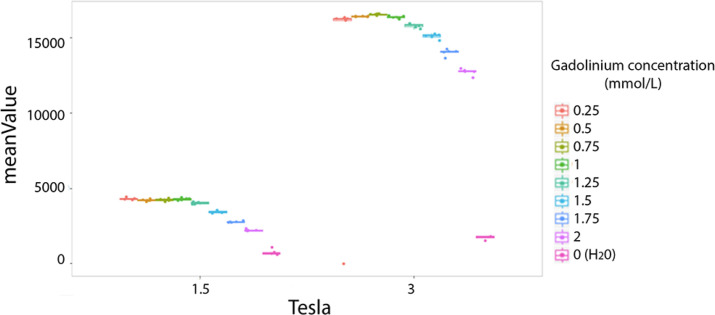
Figure 3.
Difference of phantoms textures features values at 1.5 and 3T. Example of the mean value. Each colored dot groups shows the mean value calculated from repeated phantom MRI acquisition (one dot per MRI acquisition) in different homogeneous tubes with different concentration of Gadolinium chelate (on color per tube), respectively at 1.5 and 3T.

