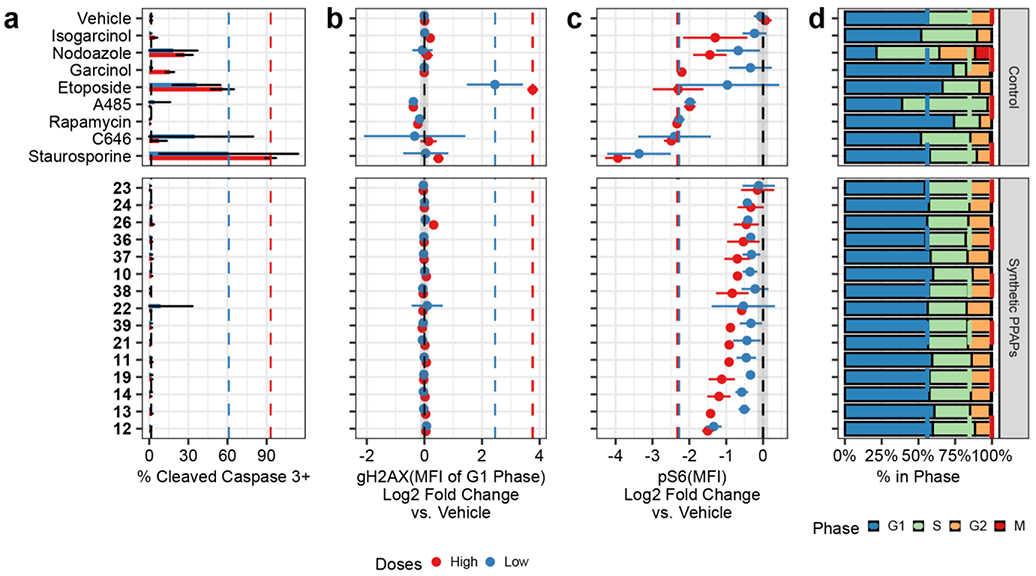
Figure 6. Multiplexed Bioactivity Assessment of the SAS library with Reference Compounds.


Jurkat cells were treated for 16 h at two doses (high - 10 μM, low - 1 μM), with the exception of rapamycin (10 nM and 1 nM) and staurosporine (1 μM and 100 nM). Each panel represents an average of 3 replicates of a single marker [channel]: a) Casp3 as a marker of apoptosis [PE]; b) γH2AX as a marker of DNA damage [PerCPCy5.5], c) pS6 [Ser235/236] as a marker of mTOR/ERK signaling [Alexa Fluor 647]; and d) Cell cycle distribution, assessed using biaxial gating on DNA content [YO-PRO-1] and phospho-histone H3 (Ser28) [PE-Cy7]. Median fluorescence intensity (MFI) of γH2AX and pS6 were normalized to the average of the two vehicle-treated wells. The error bars represent the 95% confidence interval for each point estimate. The dashed lines in panels A-C show the vehicle-treated wells (black) and the reference compounds for each channel at the high (red) and low (blue) doses. e) SASs evaluated.
