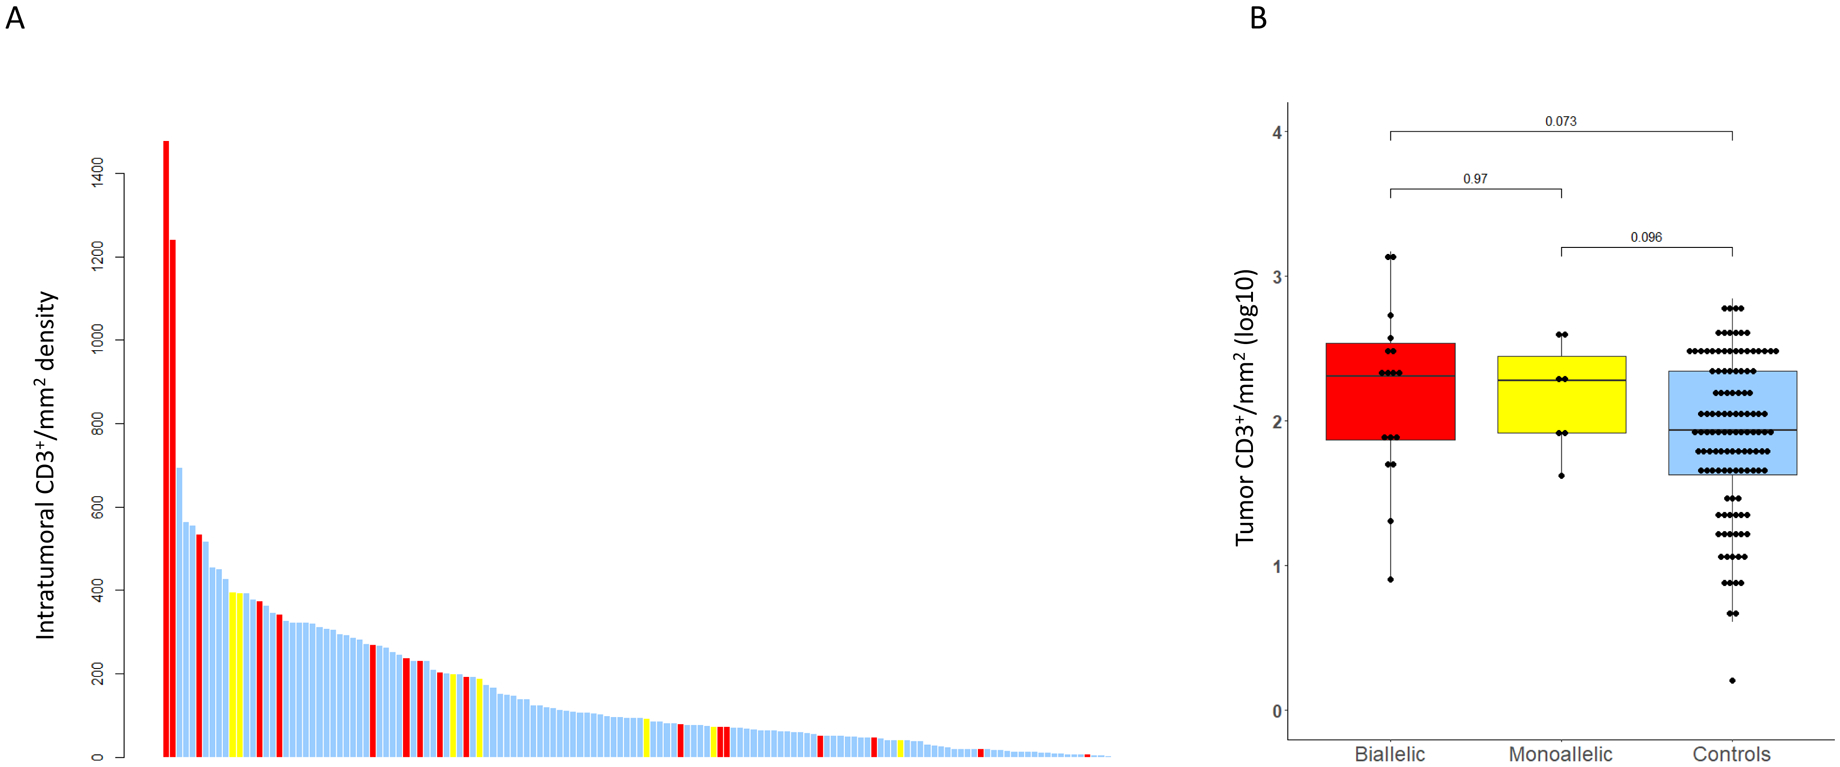
Figure 4.

Tumor infiltrating lymphocytes (TILs) analyses: A. Intratumoral CD3+ TILs per mm2. Bar Chart depicting intratumoral CD3+/mm2 density (y-axis) in CDK12 biallelic cases in red, monoallelic cases in yellow, and controls in blue.
B. Box and Whisker plot of log10-transformed intratumoral CD3+ cell density per mm2 depicting CDK12 biallelic in red, monoallelic cases in yellow, and control cases in blue.
