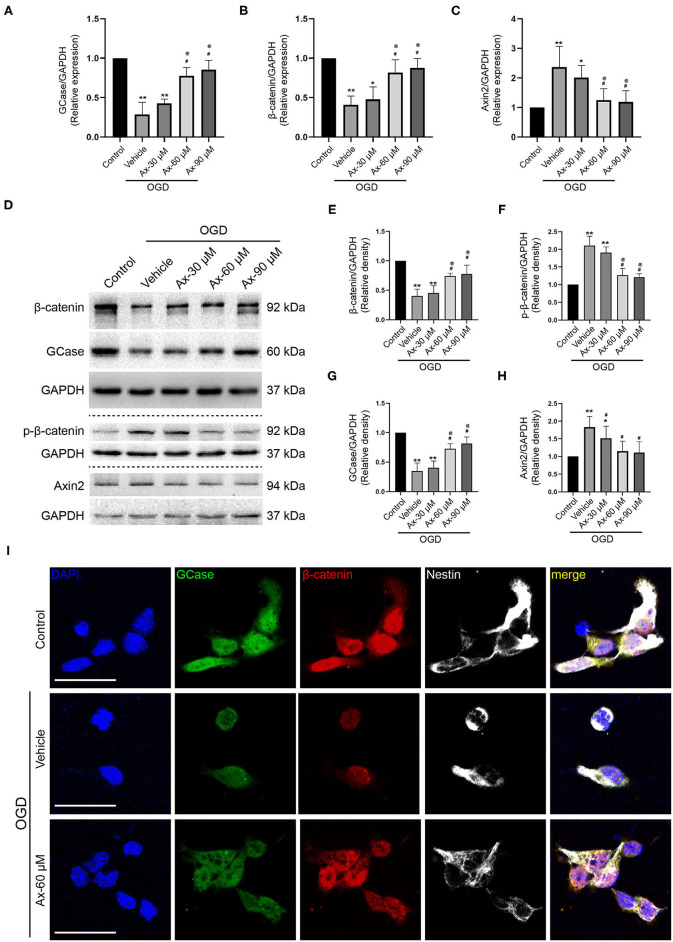
Figure 5.
Ax increases the expression of GCase and β-catenin when NSCs exposed to OGD. (A–C) Statistical analysis of GCase (A), β-catenin (B) and Axin2 (C) mRNA expression using RT-qPCR assays in different groups. *P < 0.05, **P < 0.01 vs. control group; #P < 0.05 vs. OGD + Vehicle; @P < 0.05 vs. OGD + Ax-30 μM. (D) Bands depicted the expression of GCase, β-catenin, p-β-catenin and Axin2 in different groups. GAPDH was used as an internal control. (E–H) Semi-quantitative analysis of β-catenin (E), p-β-catenin (F), GCase (G) and Axin2 (H) expression from (D). *P < 0.05, **P < 0.01 vs. control group; #P < 0.05 vs. OGD + Vehicle; @P < 0.05 vs. OGD + Ax-30 μM. (I) Representative immunostaining images of GCase (green), β-catenin (red) and Nestin (white) in various groups. Scale bar: 20 μm. Ax, ambroxol; OGD, oxygen glucose deprivation.

