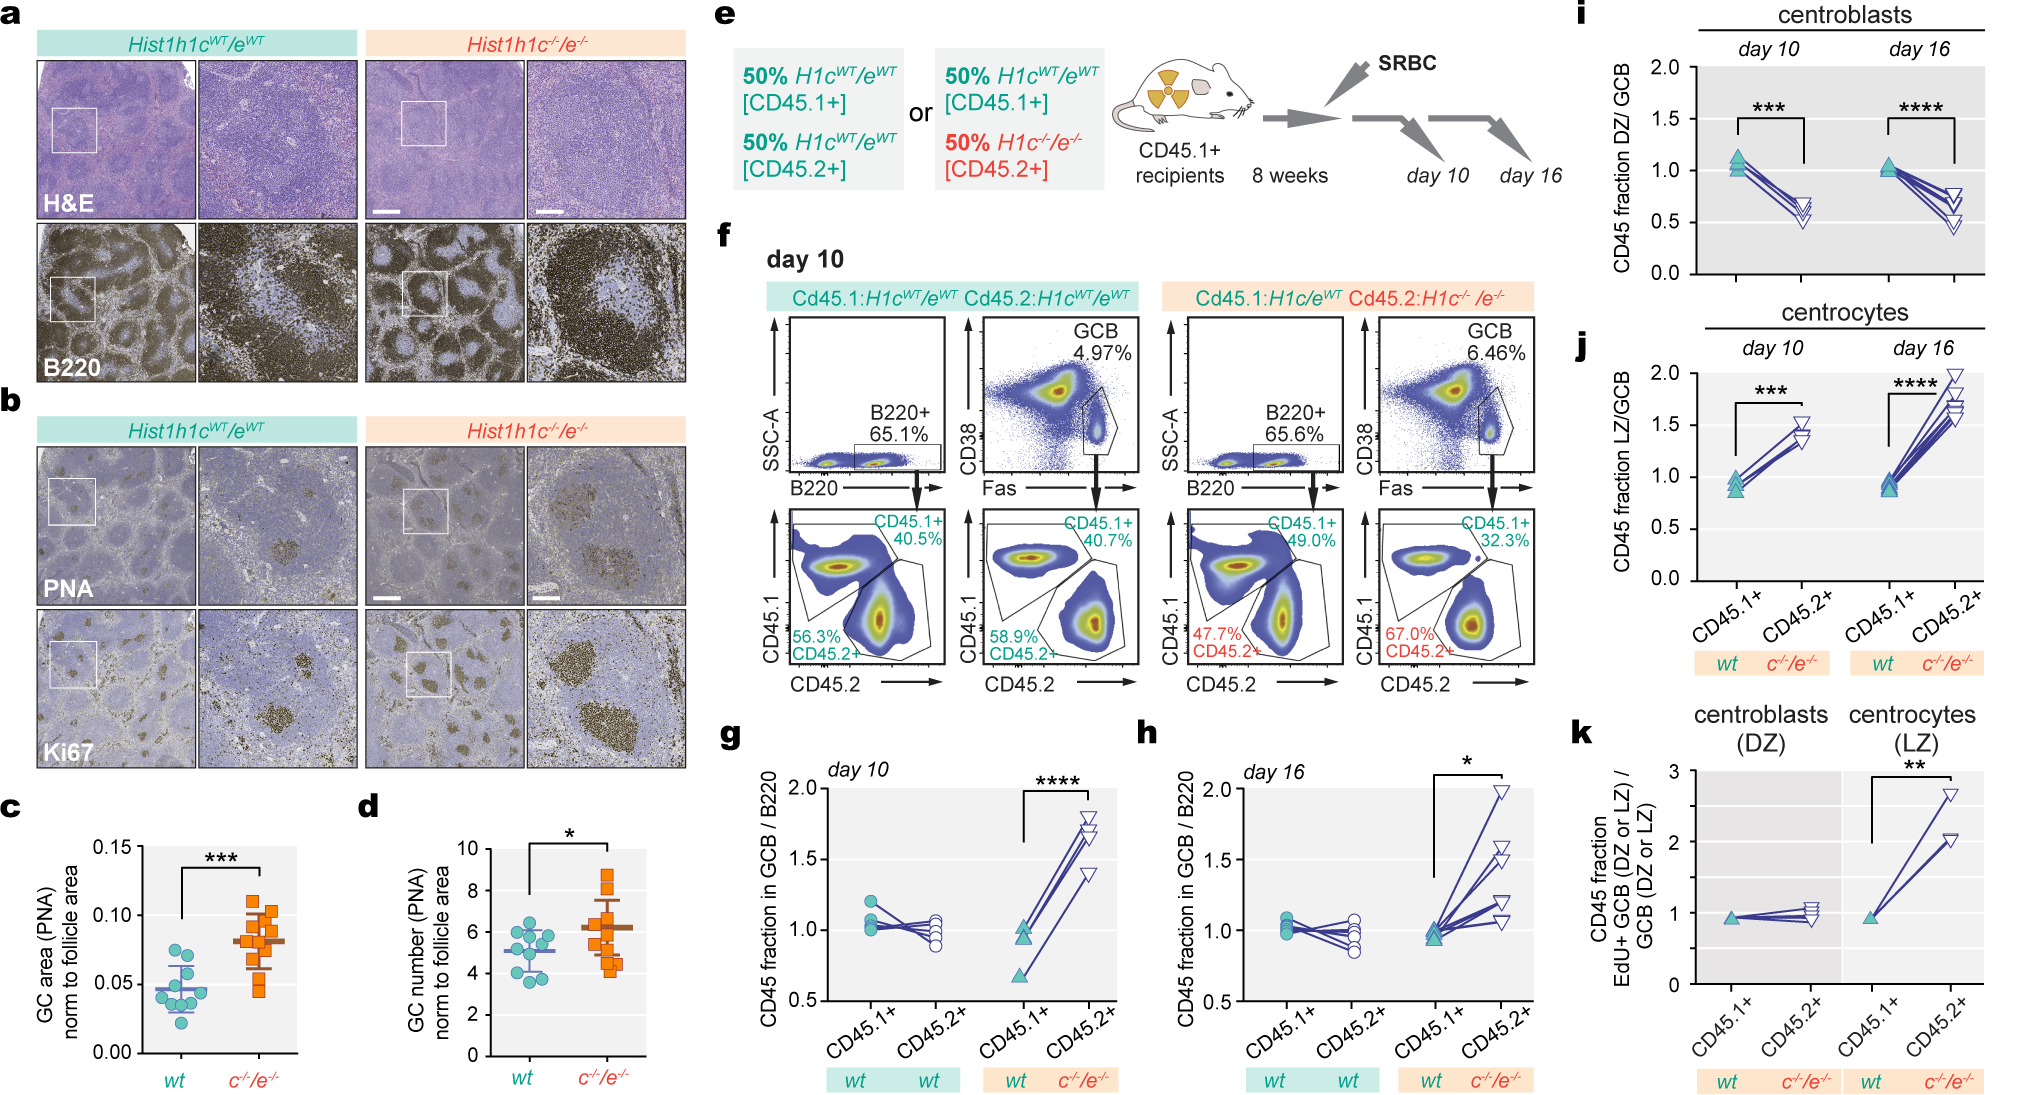
Fig. 1 |. Characterization of H1c−/−/e−/− germinal center B (GCB) cells.

a-b, Spleens of wild-type (WT) and H1c−/−/e−/− mice at day 9 after SRBC immunization stained with H&E and B220, PNA and Ki-67 antibodies. Scale bars: 500 and 100 μm for low high power images, respectively. Images are representative of three independent experiments.c-d, Quantification of GC area (PNA), n=11 per genotype, (***P=0.0004) and number of GCs, n=10 per genotype (*P=0.044) in the spleens of WT and H1c−/−/e−/ mice; mean ± S.D., unpaired t-test. e, Competitive mixed bone marrow chimera scheme. f, Representative flow cytometry plots for relative fractions of CD45.1+ and CD45.2+ within naïve B220+, and GCB-cells at day 10. g-h, Relative (Fas+CD38−) GCB/B220+ ratios for WT (CD45.1+) and H1c−/−/e−/− (CD45.2+) at day 10 (n=4 chimeras, ****P<0.0001) and day 16 (n=7 chimeras, ****P=0.0138, paired t-test). GCB/B220+ ratios in chimeras injected with WT CD45.1+ and WT CD45.2+ at day 10 (n=5) and day 16 (n=7) were unchanged. i, Relative centroblasts/GC B-cell fraction for CD45.1+ and CD45.2+ in mixed chimeras at day 10, ***P=0.0004 (n=4) and day 16, ****P<0.0001 (n=7, paired t-test). j, Relative centrocytes/GCB-cell fraction for CD45.1+ and CD45.2+at day 10, ***P=0.0005 (n=4) or day 16, ****P<0.0001 post-immunization (n=7). k, Relative EdU+ DZ/DZ GC B-cells (n=4) or EdU+ LZ/LZ GCB-cells (n=3, **P= 0.0040, two-sided paired t-test) for WT (CD45.1+ and H1c−/−/e−/− (CD45.2+) fractions 7 days post immunization. Data are mean ± SD.
