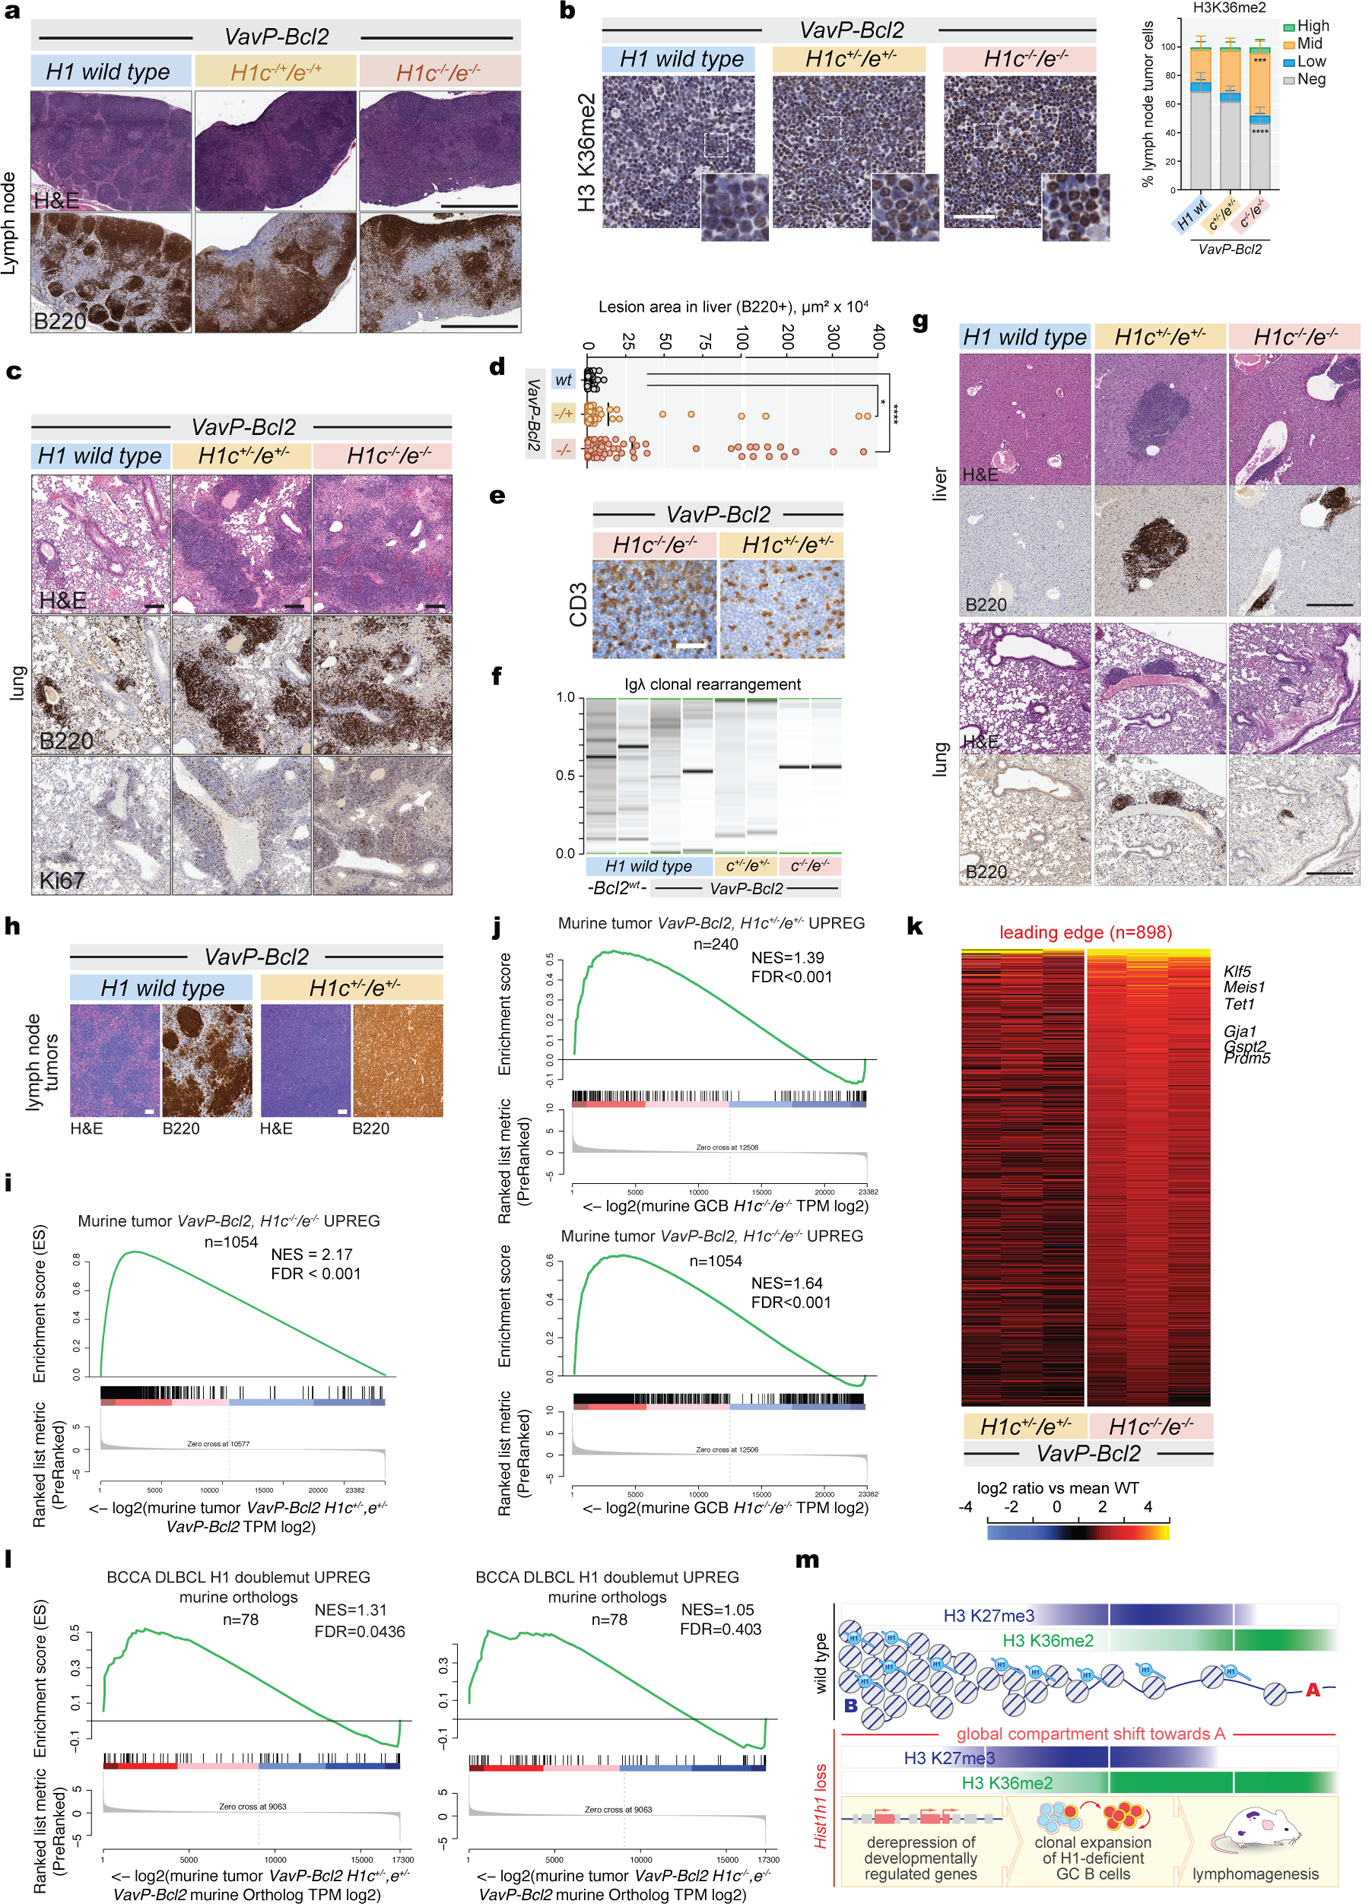
Extended Data Fig.10 |. H1c/e loss leads to aggressive Vav-PBcl2 lymphomas with DLBCL-like morphology.

a, Immunohistochemistry images of lymph node stained for H&E and B220 from VavP-Bcl2;H1c−/−/e−/−, VavP-Bcl2;H1c−/+/e−/+, and VavP-Bcl2;H1 wild type animals at day 164. Scale bar, 1 mm. Images are representative of n=11 mice per genotype examined over 2 independent experiments. b, Representative immunohistochemistry stains of lymphomatous VavP-Bcl2;H1c−/−/e−/−, VavP-Bcl2;H1c−/+/e−/+, and VavP-Bcl2;H1 wild type lymph nodes stained with H3K36me2 ,and quantification of intensity (binned as high, mid, low and negative). Scale bar, 50 μm. Tissue derived from 3 animals per genotype with 4 tumor lymph nodes each. Data are mean±sd. two-sided unpaired t-test. c, Immunohistochemistry images of lung tissue stained for H&E, B220 and Ki67 from VavP-Bcl2;H1c−/−/e−/−, VavP-Bcl2;H1c−/+/e−/+, and VavP-Bcl2;H1 wild type animals at day 164. Scale bar, 100 μm. Images are representative of n=11 mice per genotype examined over 2 independent experiments. d, Quantification of B220 lesion areas in liver tissue (Fig. 5c) from VavP-Bcl2;H1c−/−/e−/− (****P<0.0001) and VavP-Bcl2;H1c−/+/e−/+ (*P=0.0308) compared to VavP-Bcl2 (n=7 mice per genotype, mean±SD; two-sided unpaired t-tests). e, Immunohistochemistry stains for CD3 from VavP-Bcl2;H1c−/−/e−/− and VavP-Bcl2;H1c−/+/e−/+ lymphomas. Scale bar, 50 μm. Images are representative of n=4 mice per genotype examined over 2 independent experiments. f, PCR for Igλ clonal rearrangement to report on tumor clonality of B220+ cells from VavP-Bcl2;H1c−/−/e−/−, VavP-Bcl2;H1c−/+/e−/+, VavP-Bcl2; and WT mice at day 164. g, Immunohistochemistry stains for H&E and B220 in liver and lung tissues from H1c−/−/e−/−, H1c−/+/e−/+, and WT mice at day 164. Scale bar, 500 μm. Images are representative of n=6 mice per genotype examined over two independent experiments. h, Immunohistochemistry images of lymph node tissue stained for H&E and B220 from VavP-Bcl2;H1c−/+/e−/+ and VavP-Bcl2; H1 wild type mice. Images are representative of n=4 mice per genotype examined over two independent experiments. Scale bars, 100 μm. i, GSEA with the VavP-Bcl2;H1c−/−/e−/− vs VavP-Bcl2 lymphoma upregulated gene set ranked against log2 fold-change changes from murine VavP-Bcl2;H1c−/+/e−/+ vs VavP-Bcl2. j, Top: GSEA with genes upregulated in VavP-Bcl2;H1c−/+/e−/+ vs VavP-Bcl2 lymphomas using the ranked log2 fold-change in murine H1c−/−/e−/− GC B-cells. Bottom: GSEA with genes upregulated in VavP-Bcl2;H1c−/−/e−/− vs VavP-Bcl2 mice using the ranked log2 fold-change in murine H1c−/−/e−/− GC B-cells. k, Heatmap showing differential expression of leading edge genes (n=898) from VavP-Bcl2;H1c−/−/e−/− and VavP-Bcl2;H1c−/+/e−/+ lymphomas. l, GSEA with human DLBCL H1C/E double mutant upregulated genes, against the ranked log2 fold-change gene expression profiles of murine VavP-Bcl2;H1c−/+/e−/+ (left) and VavP-Bcl2;H1c−/−/e−/− (right) lymphomas. m, Summary model depicting chromatin as contiguous B-to-A space, with H3 K27 and K36 methylations occupying distinct compartments within. Loss of H1 results in global shift of compartment interactivity towards A, with both H3 K27 and K36 methylations shifting into ectopic regions. Most compacted regions devoid of either K27 or K36 methylation appear largely protected from H1 loss. Biological effects of H1 loss in GC B-cells are summarized below.
