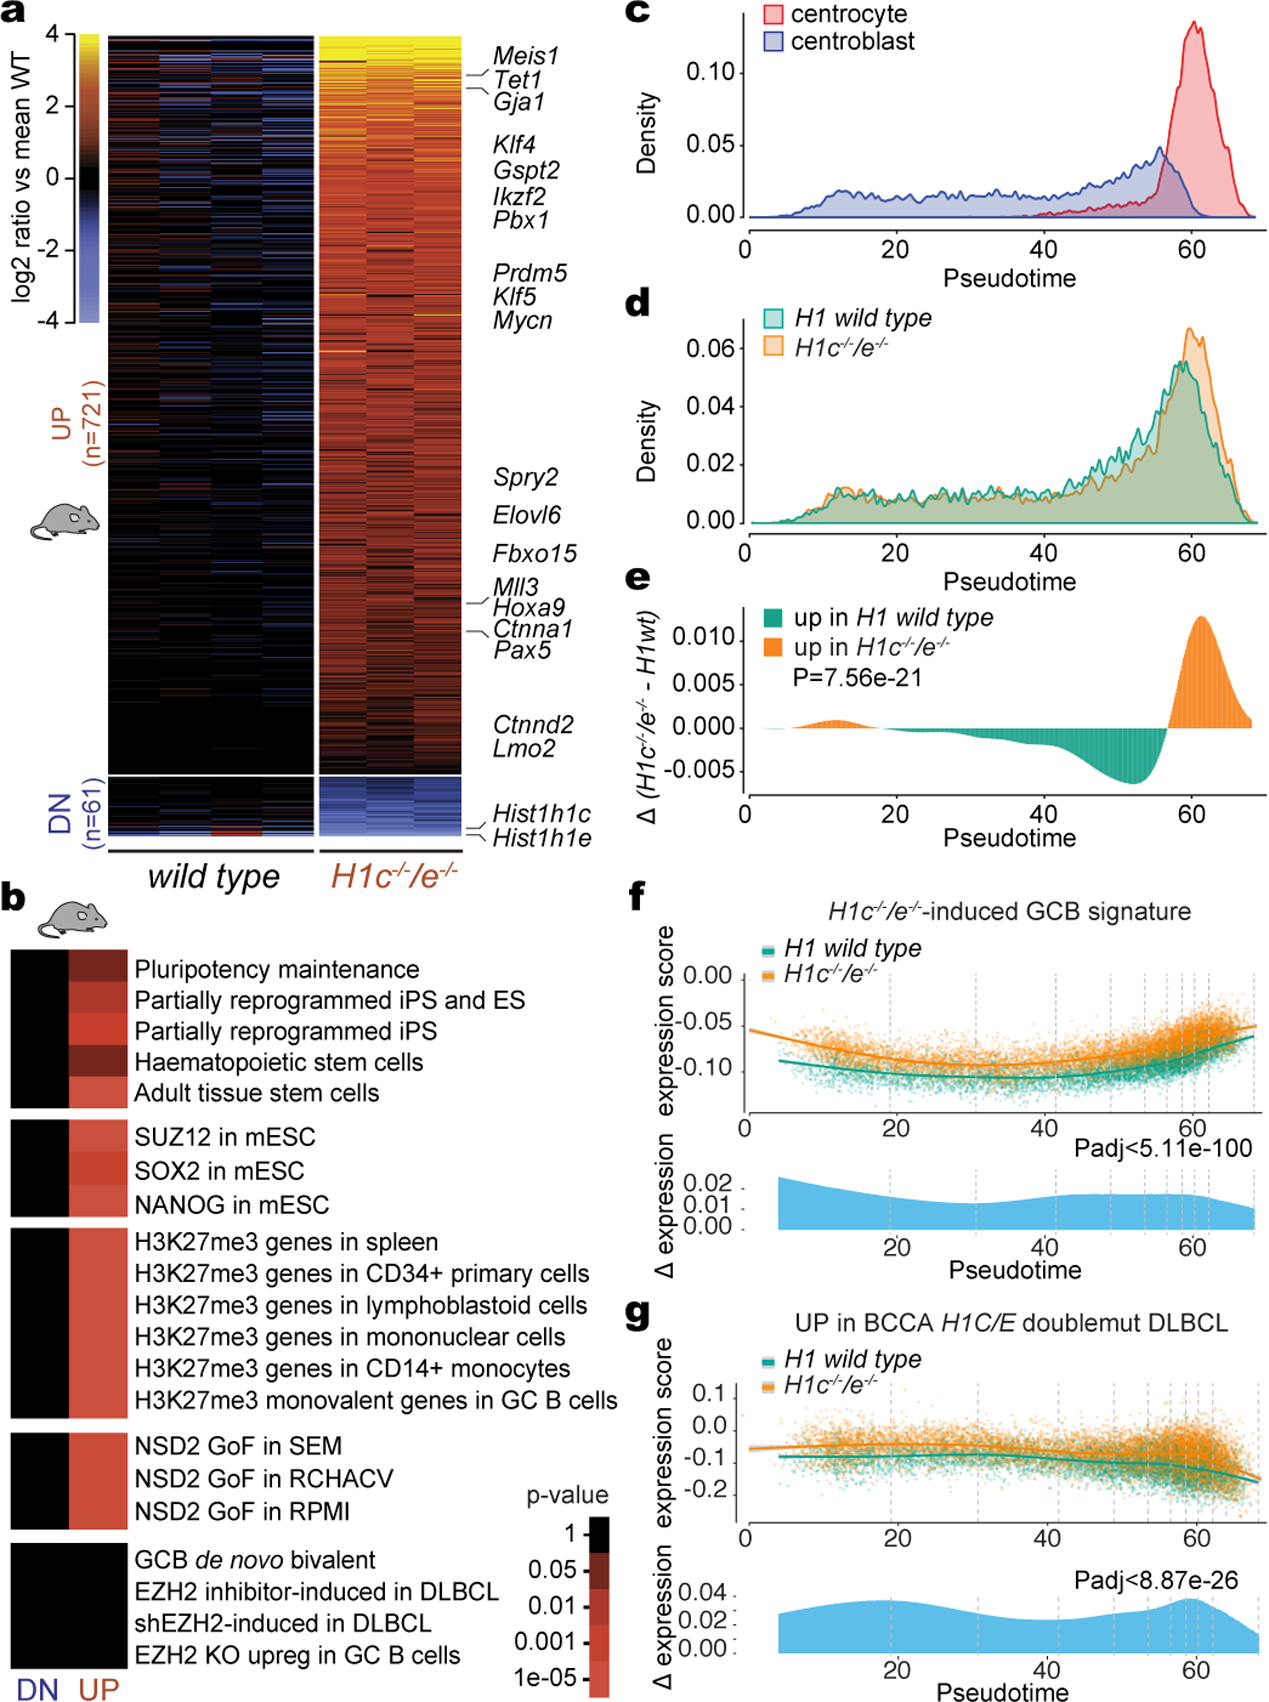
Fig. 2 |. H1c/e deficiency induces stem cell transcriptional profiles in GCB cells.

a, Heatmap of differentially expressed genes (FDR <0.05, fold change >1.5) in sorted GCB cells from independent H1c−/−/e−/− (n=3) and WT (n=4) mice. b, Gene pathway enrichment analysis of upregulated and downregulated genes in H1c−/−/e−/− vs WT GC B-cells (hypergeometric mean test). c, Single-cell RNA-seq density plot illustrating the frequency of centroblasts and centrocytes across the Slingshot pseudotime axis. d, Density plot of the frequency of H1c−/−/e−/− (n=9807 cells) and WT (n=6774 cells) GC B-cells across the pseudotime axis. Data are pooled from two independent biological replicates. e, Differential density plot on (d) tested between H1c−/−/e−/− and WT with two-sided Wilcoxon analysis. f-g, Top: Expression of the upregulated H1c−/−/e−/− GC B-cell gene signature (f) and human H1C/E mutant DLBCL gene signature (g) was plotted for each cell on the Y axis with spline curves representing the average for H1c−/−/e−/− and WT cells. Bottom: Differential expression shown as delta spline plot across pseudotime, tested by two-sided Wilcoxon within ten bins of equal cell number (dashed lines).
