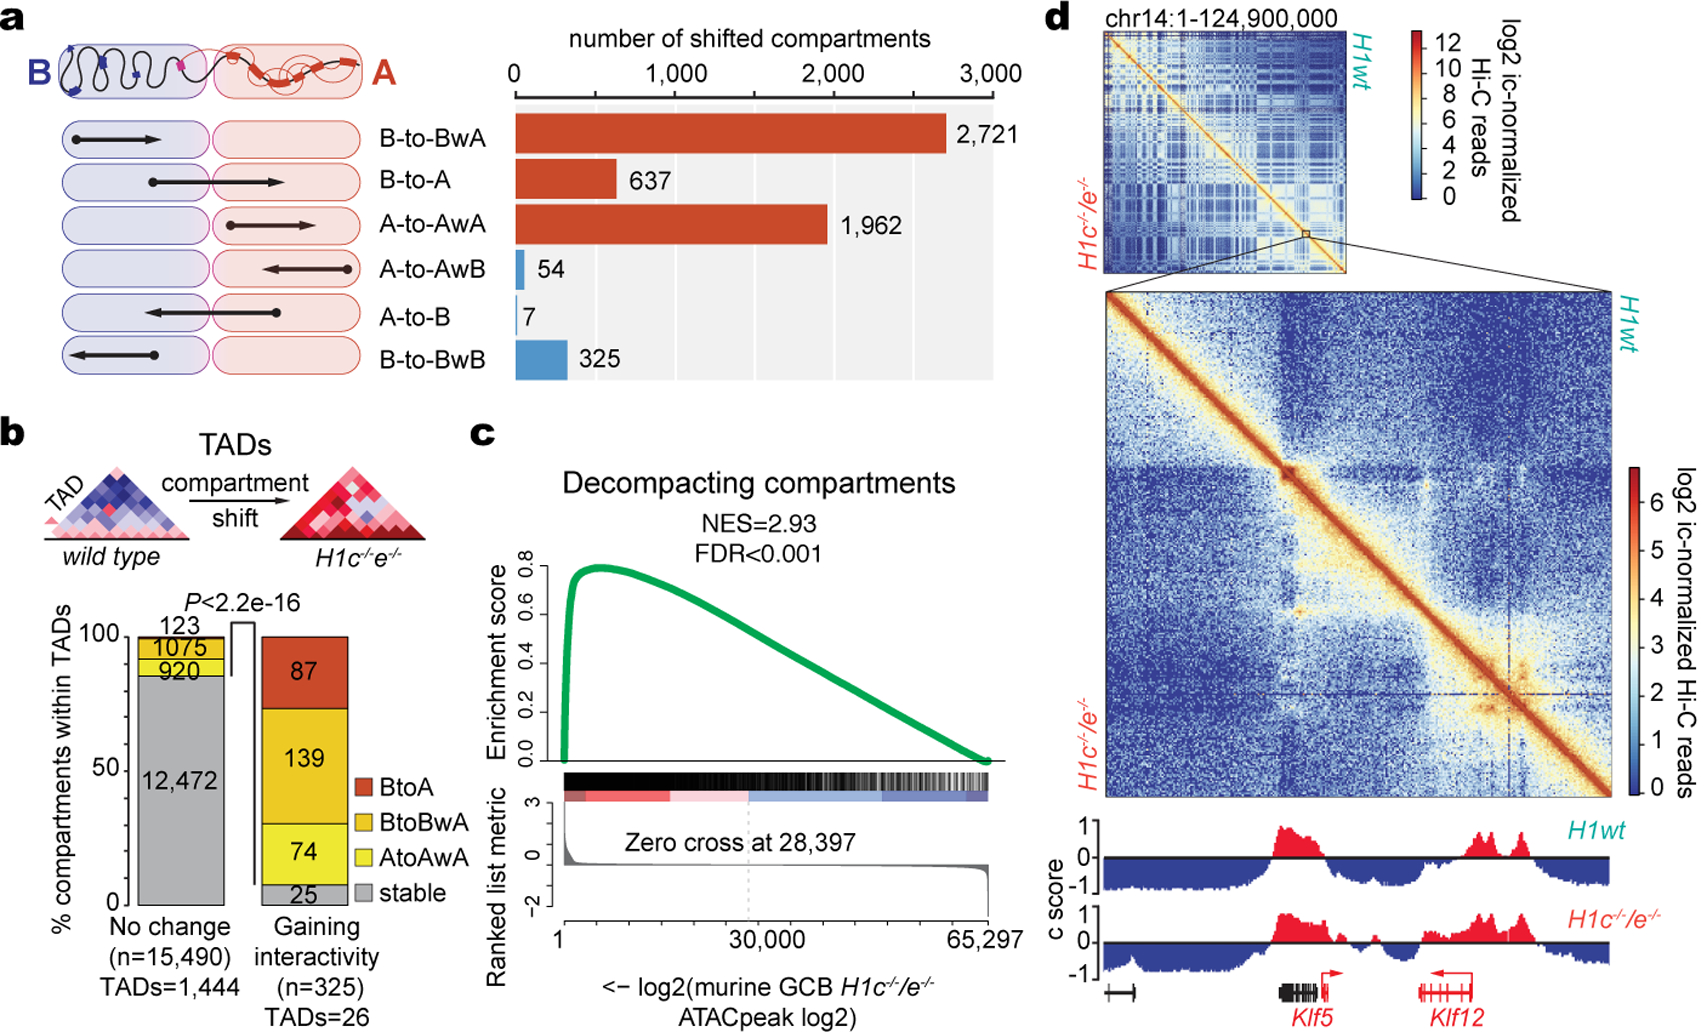
Fig. 3 |. H1c/e deficiency induces stem cell transcriptional profiles in GCB cells.

a, Schematic of directionality of shifting within defined compartments (left) and number of shifted compartment regions (100 kb scale) (right), showing decompaction in red and compaction in blue bars. b, Bar graph showing the proportion of stable or decompacting 100 kb compartment bins within TADs gaining (n=26) or non-changing (n=1,444) intra-TAD interactivity in H1c/e deficient GC B-cells. Two sided Fisher’s exact test, P<2.2e-16. c, GSEA analysis of ATAC-seq peaks from decompacting compartments against ranked ATAC-seq peak log2 fold changes in H1c−/−/e−/− vs wild-type H1 GC B-cells. d, Top, contact heat map of chromosome 14, showing WT on the top right and H1c−/−/e−/− GC B-cells in the lower left. Bottom, contact heat map in region containing Klf5 locus. IGV tracks below represent the Eigenvector for compartments A (red) and B (blue) positioned on Chr14:98,000,000–101,000,000.
