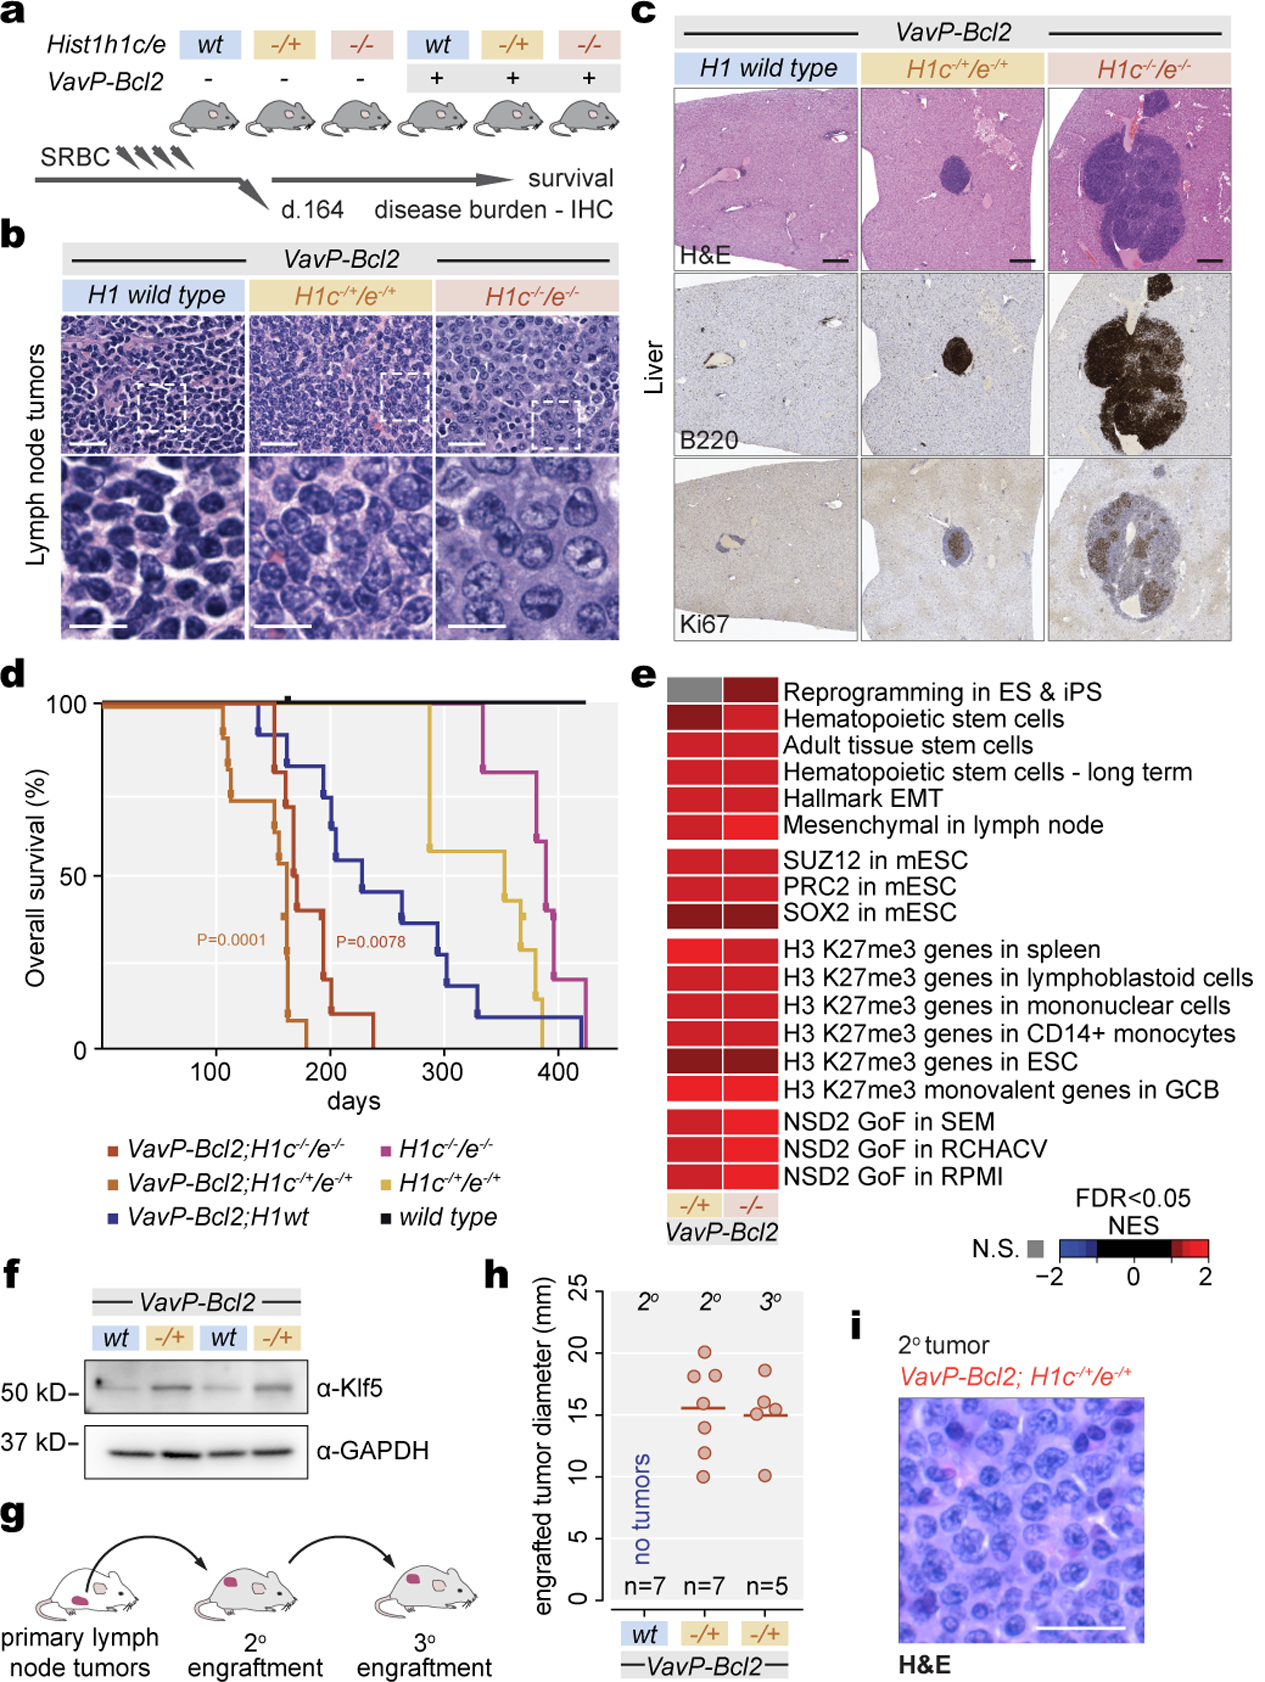
Fig. 5. H1c/e deficiency leads to aggressive VavPBcl2 lymphomas.

a, Lymphomagenesis experiment scheme. b, IHC images of H&E-stained lymph nodes from animals of indicated genotypes. Scale bars: 25 μm (top) and 10 μm (bottom). Images are representative of two independent experiments. c, Representative IHC images of liver tissue stained for H&E, B220 and Ki67 from animals of indicated genotypes. Scale bar, 100 μm. d, Kaplan-Meier curves depicting overall survival of VavP-Bcl2;H1c−/−/e−/− (n=10), VavP-Bcl2;H1c−/+/e−/+ (n=11), VavP-Bcl2;H1wt (n=11), H1c−/+/e−/+ (n=7), H1c−/−/e−/− (n=5), and WT mice (n=1), assessed by time of death or euthanasia after bone marrow transplantation (BMT). Log-rank test P-value is shown compared to VavP-Bcl2; H1wt control. e, Normalized enrichment score of GSEA on indicated gene sets, using ranked log2 fold change in expression between indicated genotypes vs VavP-Bcl2 control. f, Immunoblot for Klf5 protein from VavP-Bcl2;H1c−/+/e−/+ and control VavP-Bcl2;H1wt B220-enriched lymphoma cells with GAPDH loading control. Sample pairs collected over two independent experiments are shown. g, Tumor engraftment assay scheme. h, Tumor diameter after six weeks in secondary engraftments (n=7 recipients per genotype) and tertiary engraftments of VavP-Bcl2;H1c−/+/e−/+ into seven recipients. i, H&E staining of secondary engrafted VavP-Bcl2;H1c−/+/e−/+ lymphomas. Scale bar, 25 μm. Image is representative of n=7 mice.
