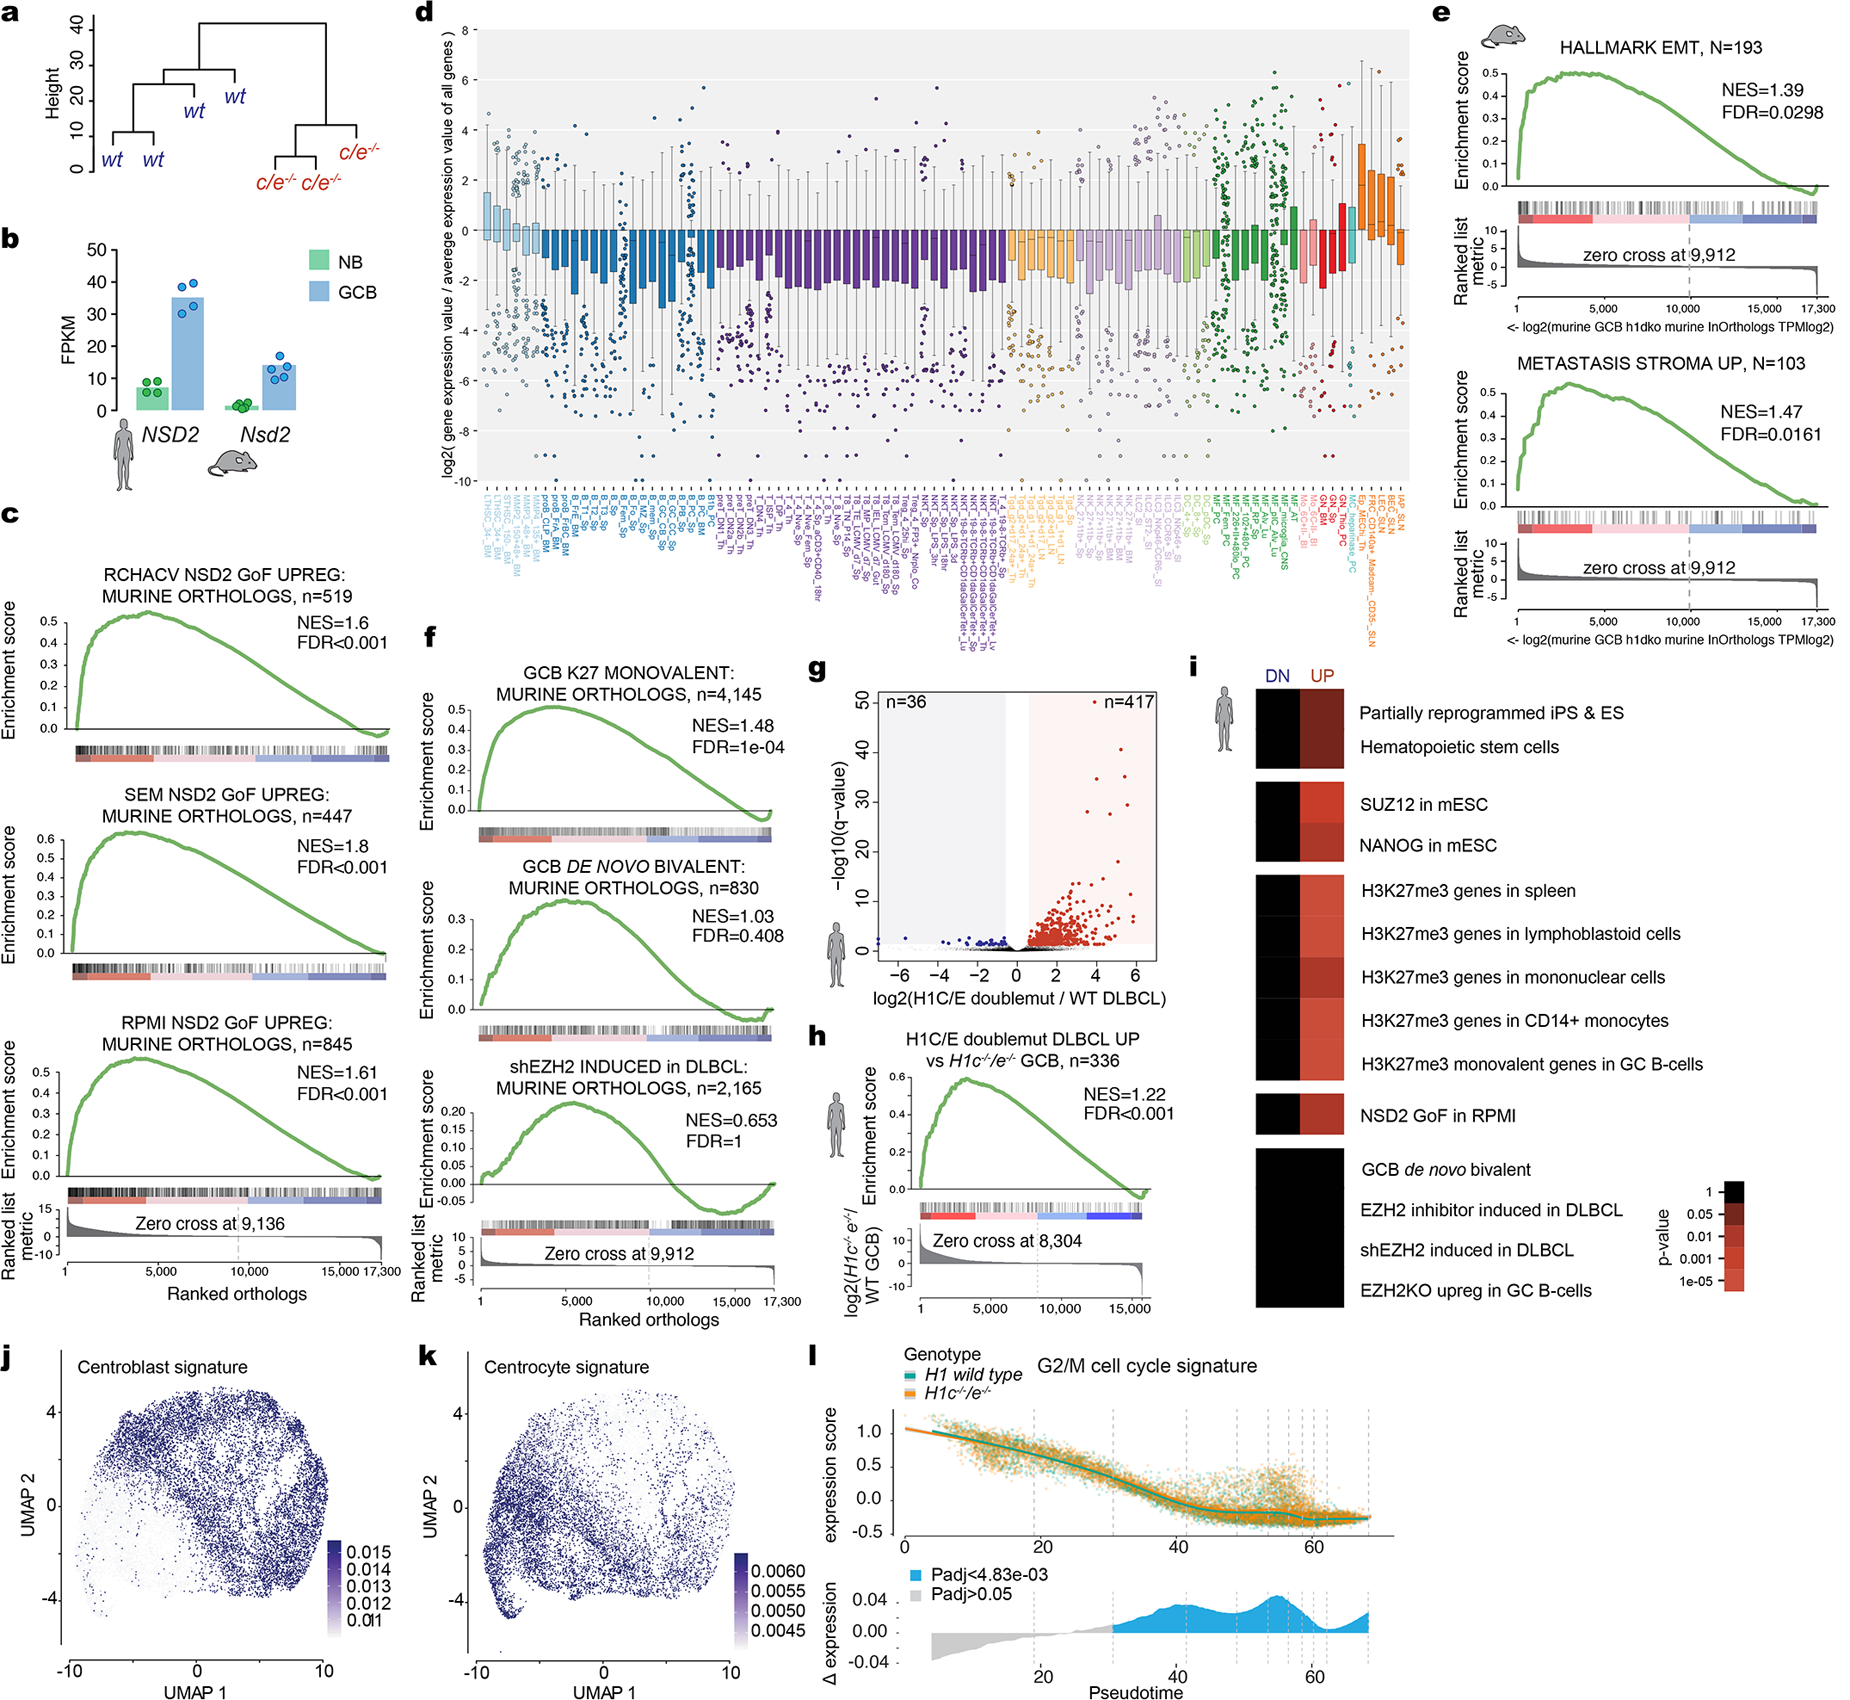
Extended Data. 4 |. H1c/e deficiency induces stem cell transcriptional profiles in GCB cells and DLBCL.

a, Unsupervised hierarchical clustering analysis of RNA-seq data from sorted H1c−/−/e−/−and wild-type H1 GCB cells, based on genes in the top 90thpercentile variability.b, FPKM expression of NSD2from human and mouse naïve B and GCB cells RNA-seq profiles. c, GSEA analysis of genes linked to NSD2 gain-of-function mutation in three cell lines (RCHACV, SEM, RPMI) against ranked murine H1c−/−/e−/−GC B cell expression changes. d, Boxplot of log2 relative gene expression normalized to average expression value of all genes from top 200 differentially upregulated H1c/e-deficient signature against ImmGen database. Boxplot center represents median, bounds of box are 1stand 3rdquartile and whiskers extend out 1.5*interquartile range from the box. e, GSEA analysis with indicated gene sets, using ranked log2 fold change in expression betweenH1c/e-deficient and wild-type murine GC B cells. f, GSEA analysis of gene sets linked to EZH2 against ranked murine H1c−/−/e−/−GC B cell expression changes. g, Volcano plot showing differentially expressed genes comparing H1C/E double mutant (n=18) vs H1 wild type DLBCL patients (n=237) (FDR <0.05, fold change >1.5). Red field denotes upregulated and blue field downregulated genes. h, GSEA analysis withH1C/E double mutant vs H1 wild-type DLBCL patient unregulated genes, using ranked log2 fold-change changes in murine GCH1c−/−/e-/−. i, Gene pathway enrichment analysis of upregulated and downregulated genes from (g), hypergeometric mean test. j-k, Sorted H1c−/−e−/−or WT GC B-cells (n=2 per genotype) were subjected to droplet based (10x) single cell RNA-seq. Centroblasts (j) and centrocytes (k) were defined based on enrichment for centroblast and centrocyte signature profiles, respectively projected onto the UMAP distribution of cells. l, Top:Expression of G2M cell cycle proliferation gene signature was plotted for each cell on the Y axis with spline curves representing the average for H1c−/−/e−/−and WT cells. Bottom: Differential expression is shown as delta spline plot (blue) across pseudotime and tested by two-sided Wilcoxon rank-sum within ten bins of equal cell number (dashed lines).
