
Figure 1. Increased number of TAMs is associated with tumor progression in a sporadic SHH-MB mouse model.
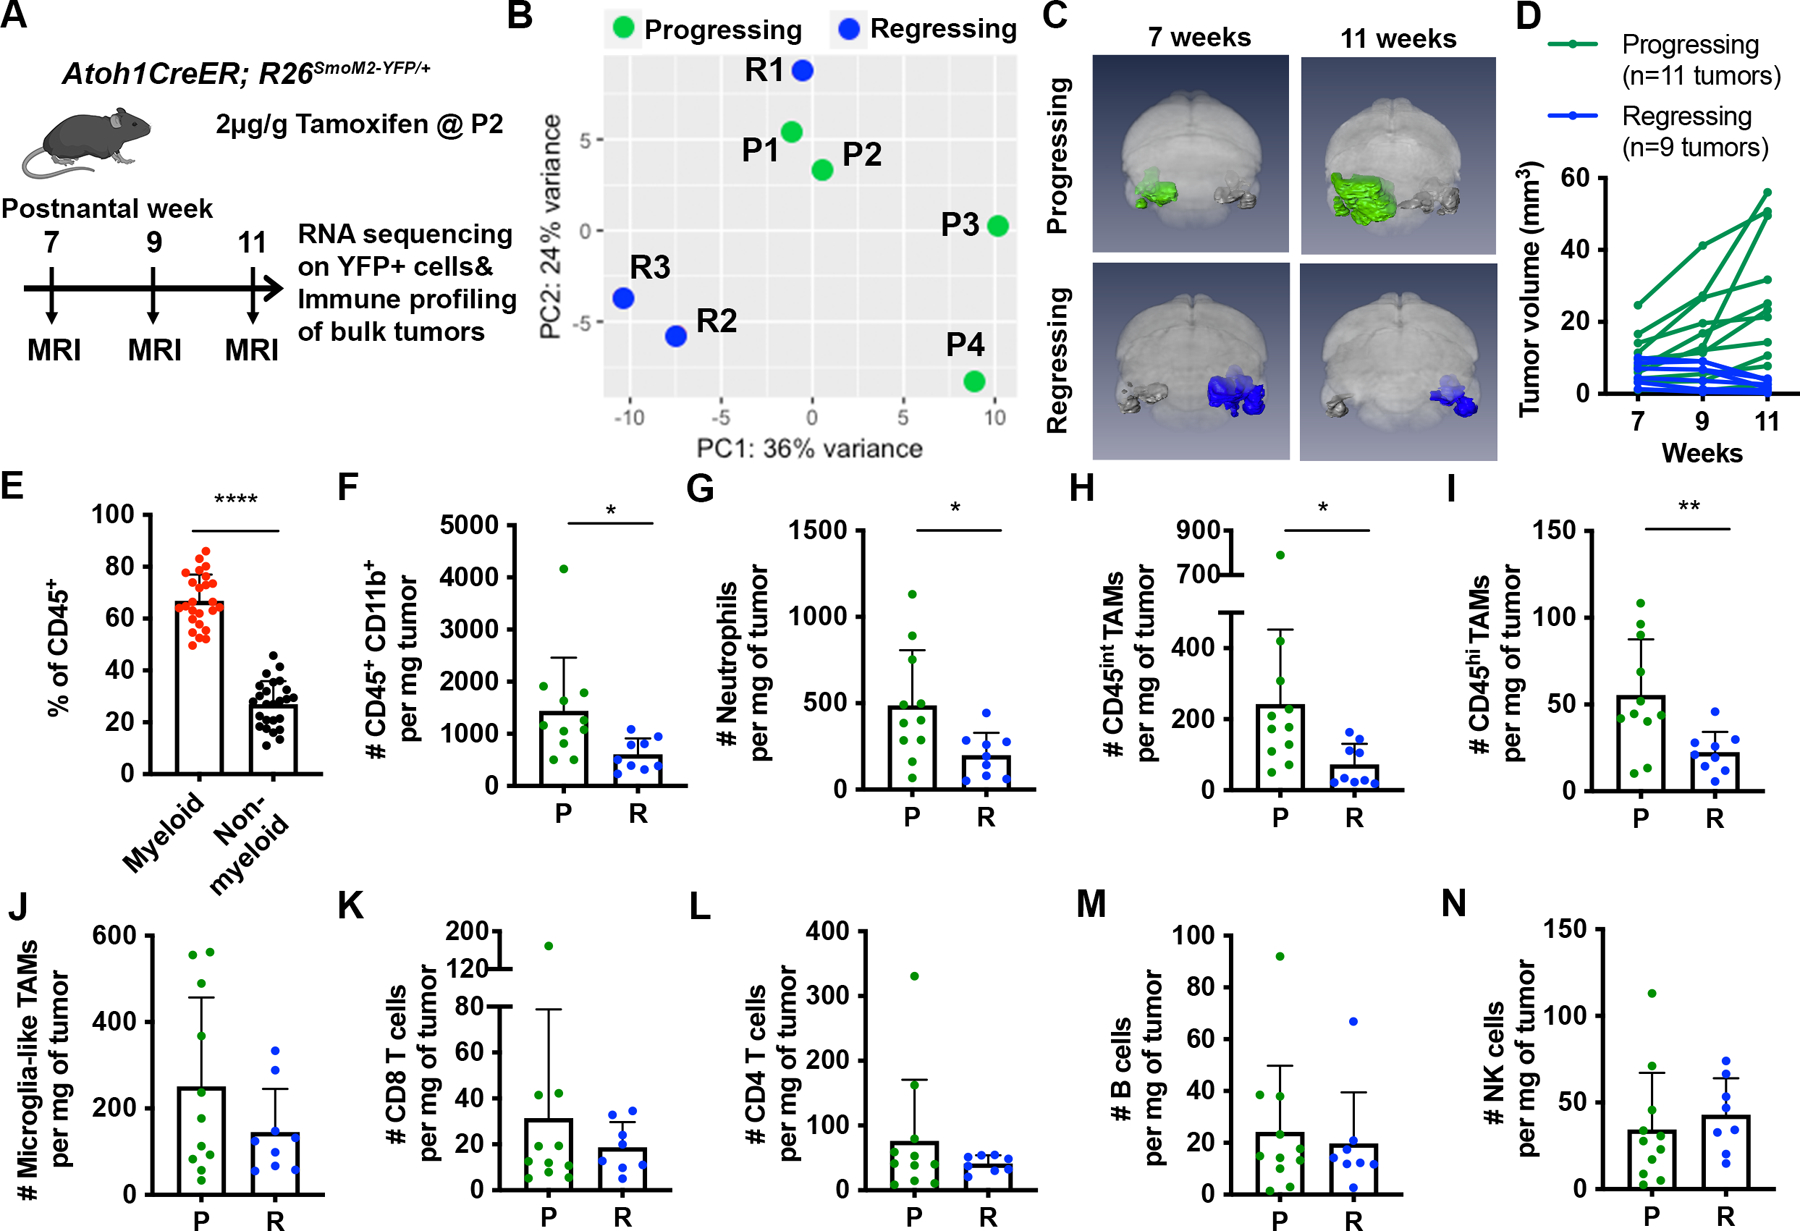
(A) Schematic representation of experimental design. (B) Principal component analysis (PCA) of progressing (P; n=4) and regressing tumors (R; n=3), which defined as having a >50% increase or >20% decrease in size between 7–11 weeks, respectively. (C) 3D MEMRI volume renderings of the brain of progressing (green) or regressing (blue) tumors in Atoh1-SmoM2 mice. (D) Tumor progression curves of progressing and regressing tumors. (E) Percentage of CD45+CD11B+ myeloid cells among all immune cells in 25 Atoh1-SmoM2 tumors (n=15 mice). (F) Number of CD45+CD11B+ myeloid cells per milligram (mg) of tumor in progressing and regressing tumors. (G–N) Number of indicated cell types per mg of tumor. Data are pooled from 3 FACS experiments. Mean ± SD. Significance was determined using unpaired t test, ****p<0.0001, **p<0.01, *p<0.05.