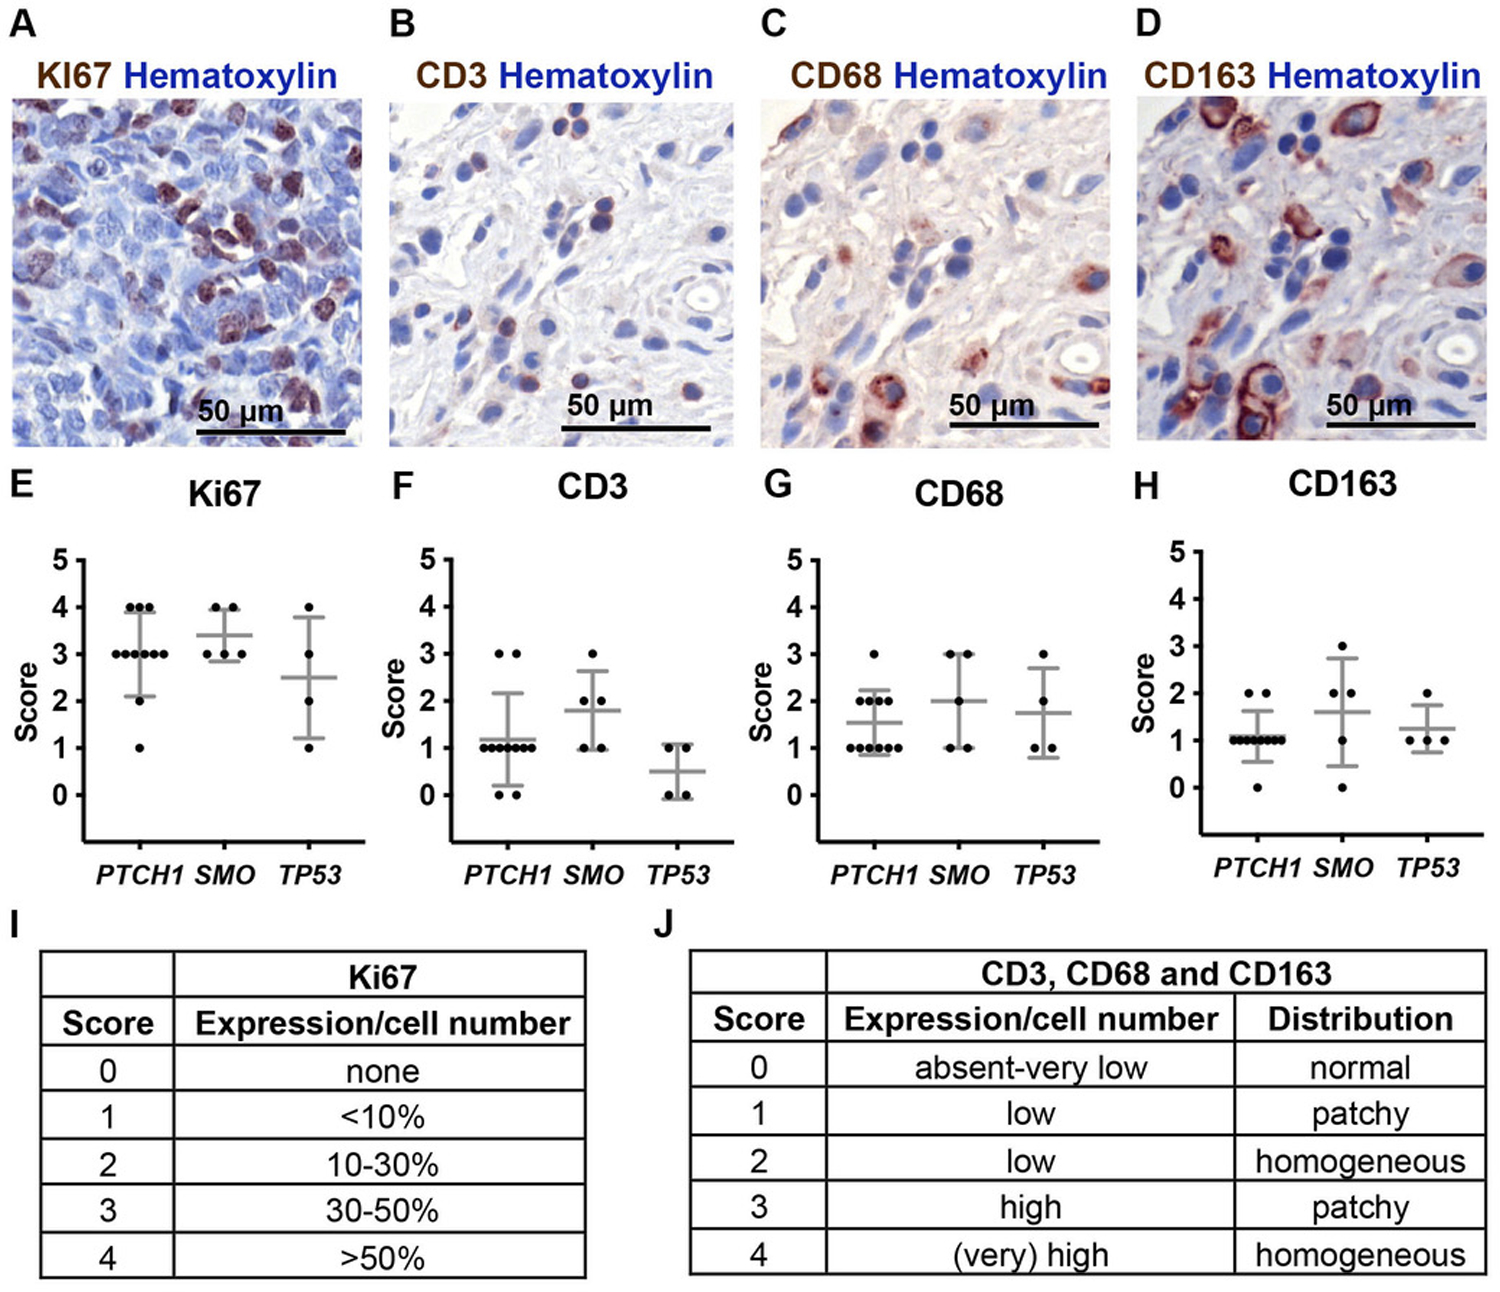
Figure 2. The amount of immune cell infiltration in human SHH-MB samples does not correlate with driver mutation.

(A–D) Representative immunohistochemical staining of Ki67 (A), CD3 (B), CD68 (C) and CD163 (D) from 20 SHH-MB samples. (E–H) Correlation between the staining of Ki67 (E), CD3 (F), CD68 (G) and CD163 (H) and driver mutation. Quantification was done on the region that had the strongest positive signal and a score was given to each sample based on the expression and distribution of positive cells as indicated in (I–J). Mean ± SD. Significance was determined using one-way ANOVA with Tukey post hoc pairwise comparison.
