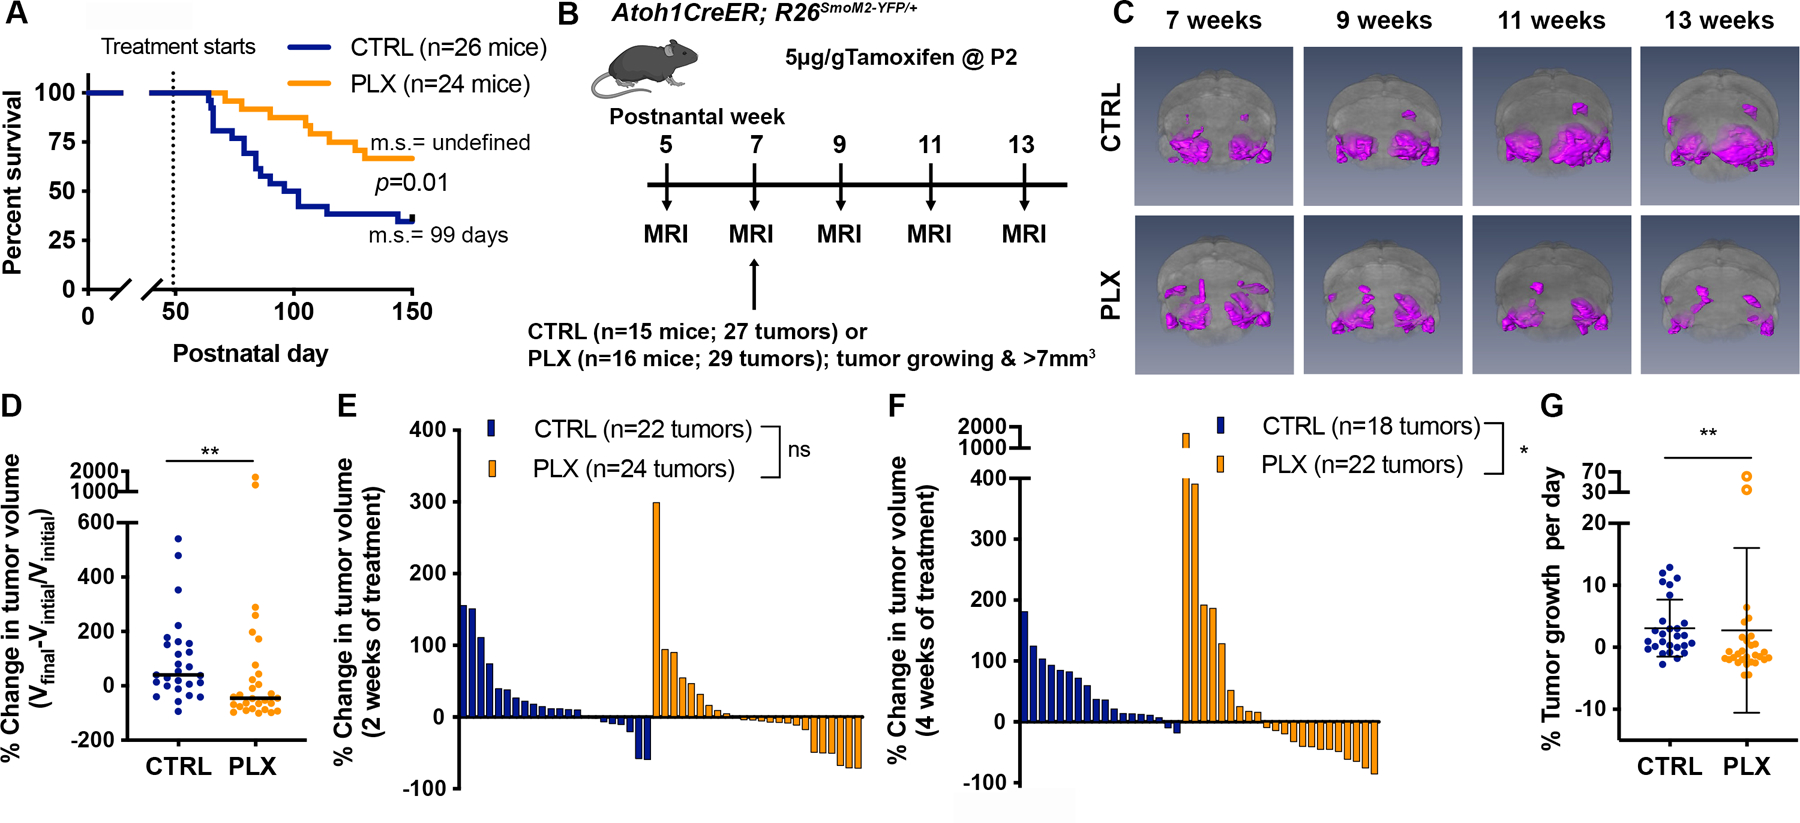
Figure 4. Depletion of TAMs prolongs mouse survival and blocks tumor progression in most Atoh1-SmoM2 mice.

(A) Kaplan–Meier curves of control (CTRL)- or PLX5622 (PLX)-treated Atoh1-SmoM2 mice. m.s. = median survival. (B) Schematic representation of experimental design. (C) 3D MEMRI volume renderings of the brain (grey) and tumors (magenta) in CTRL and PLX-treated mice at the indicated time points. (D) The overall change in tumor volume between the pre-treatment time point (Vinitial; 7 weeks) and the experimental endpoint (Vfinal; mice became symptomatic or at 13 weeks). Black line indicates median. (E–F) Waterfall plots showing the change in tumor volume from the pre-treatment time to after 2 weeks (E) and 4 weeks (F) of CTRL or PLX treatment. (G) The growth rate calculated as the percentage tumor volume change per day. The open circles indicate outlier PLX tumors that grew faster than the controls. Mean ± SD. Significance was determined using Log-rank test for (A) and Mann-Whitney test for (D–G). **p<0.01, *p<0.05, ns = non-significant.
