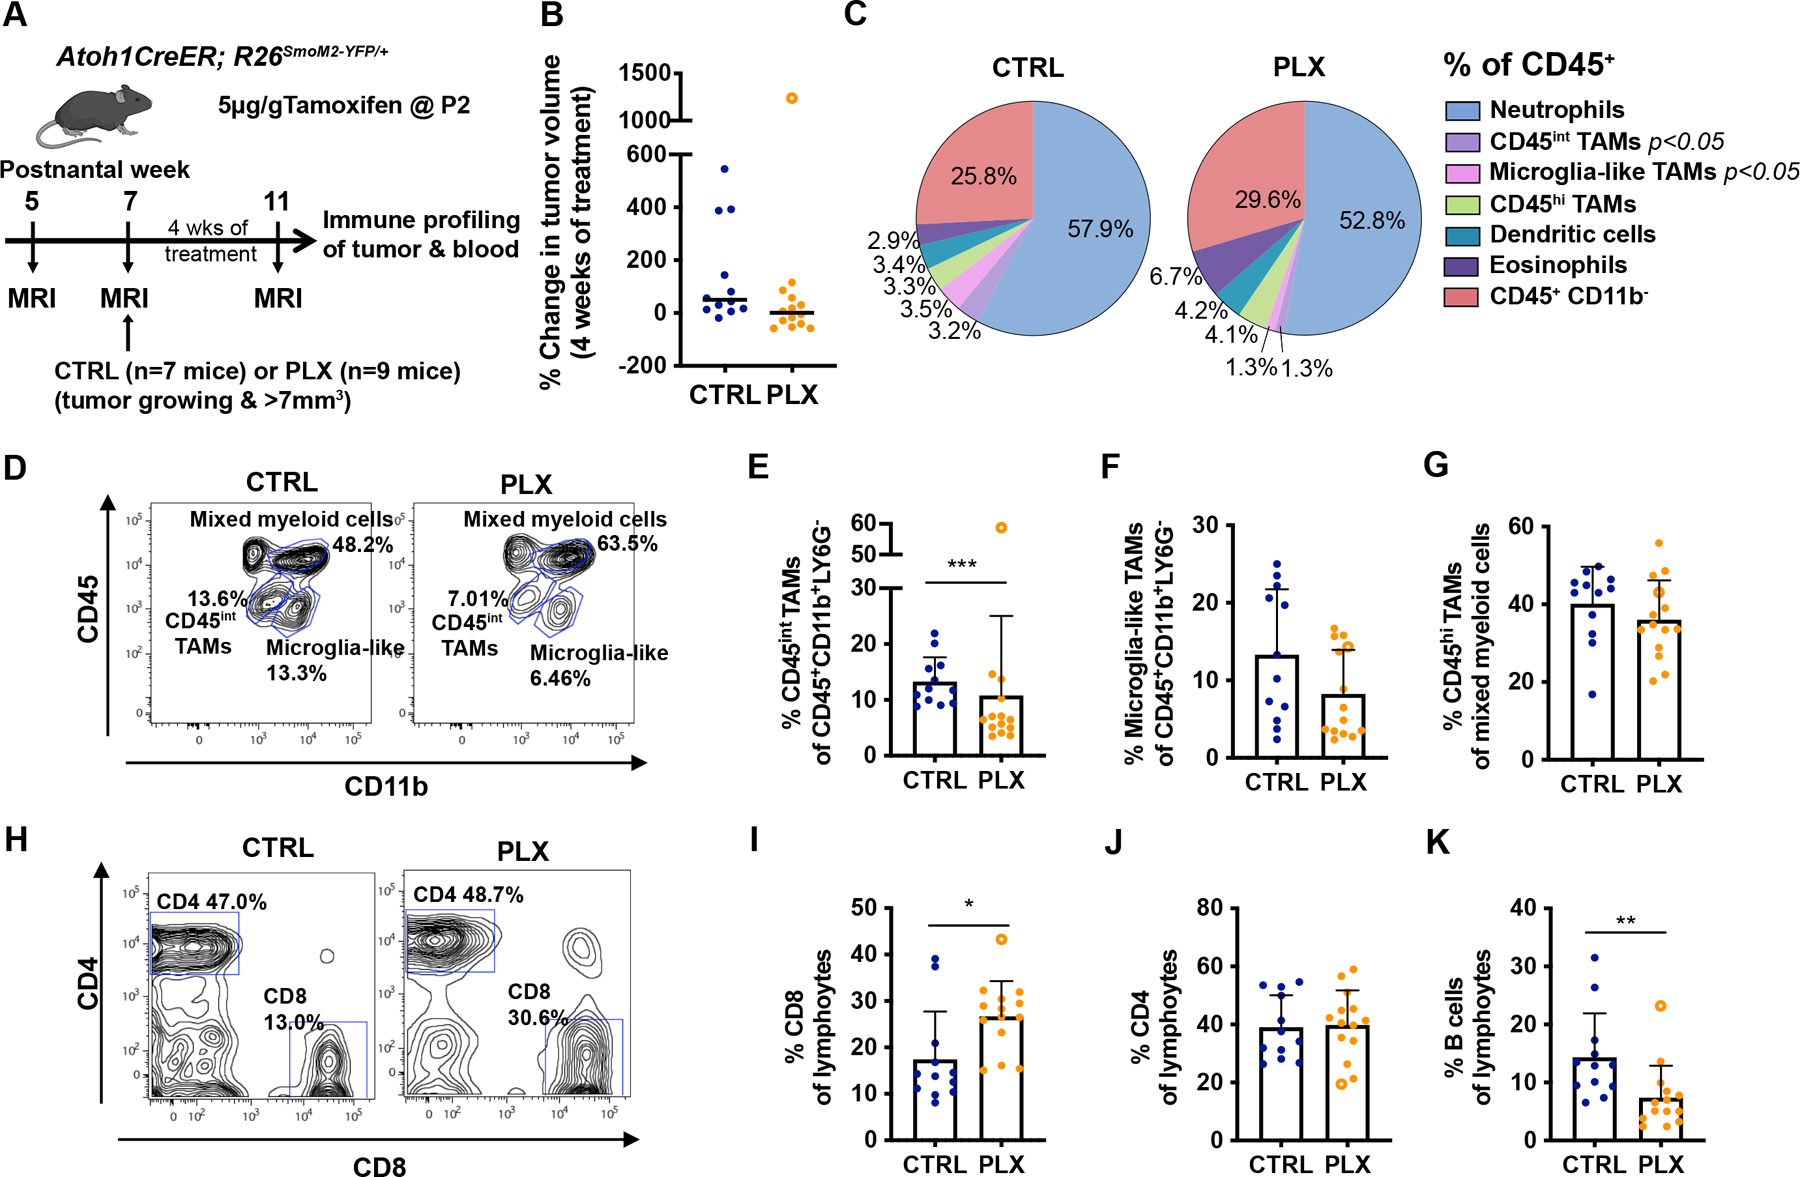
Figure 5. Atoh1-SmoM2 tumors treated for 4 weeks with PLX show a decrease of monocytes/macrophages and an increase of CD8 cytotoxic T cells.

(A) Experimental design. (B) Change in tumor volume between pre-treatment and 4 weeks of PLX treatment. The open circle in (B, E–G, I–K) indicates an outlier PLX tumor. Black line indicates median. (C) Flow cytometry quantification of myeloid cell composition in CTRL (n=12) and PLX (n=14) treated tumors. Significance was found in the CD45int TAM and microglia-like TAMs populations (See Sup Fig. 10). (D–G) Representative flow cytometry panels from the CD45+CD11B+Ly6G− population (D) showing the proportion of CD45int TAMs (E) and microglia-like TAMs (F). (G) Percentage of CD45hi TAMs of mixed myeloid population. (H–J) Representative flow cytometry panel from the lymphocytes (CD45+CD19+TCRβ+) showing the proportion of CD8+ T cells (I), CD4 T+ cells (J). (K) Percentage of B cells (CD45+CD19+B220+) of the lymphocyte population. Data are pooled from 3 FACS experiments. Mean ± SD. Significance was determined using Mann-Whitney test for (B), and performed excluding the outlier tumor by using unpaired t test for (C), (E–G) and (I–K), ***p<0.001, **p<0.01, *p<0.05.
