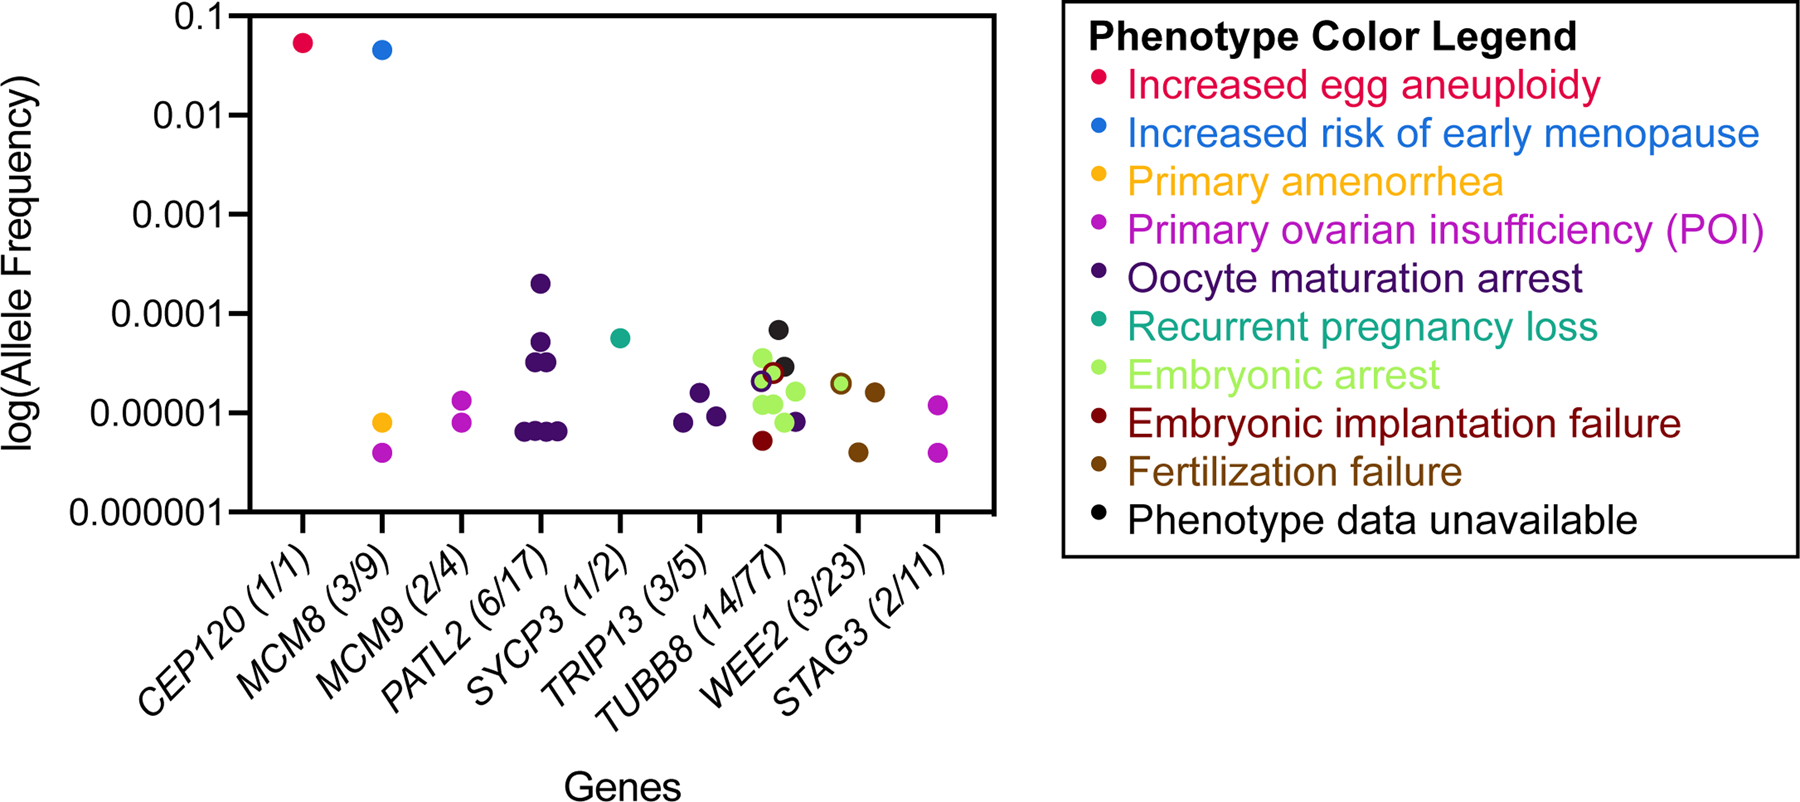
Figure 6. Population frequencies of infertility-associated variants.

The population allele frequencies of the female infertility-associated variants listed in Tables 1 through 4 were identified in the gnomAD database (v2.1.1). The number of variants that had a non-zero allele frequency in gnomAD and the total number of variants in each gene is denoted in parentheses after the gene name. Genes for which no reported infertility-associated variants are present in the gnomAD database are not included in the figure. For each allele, dot color represents an associated reproductive phenotype (see key). Multiple phenotypes are represented by two-color dots. Frequencies are shown on log10 scale.
