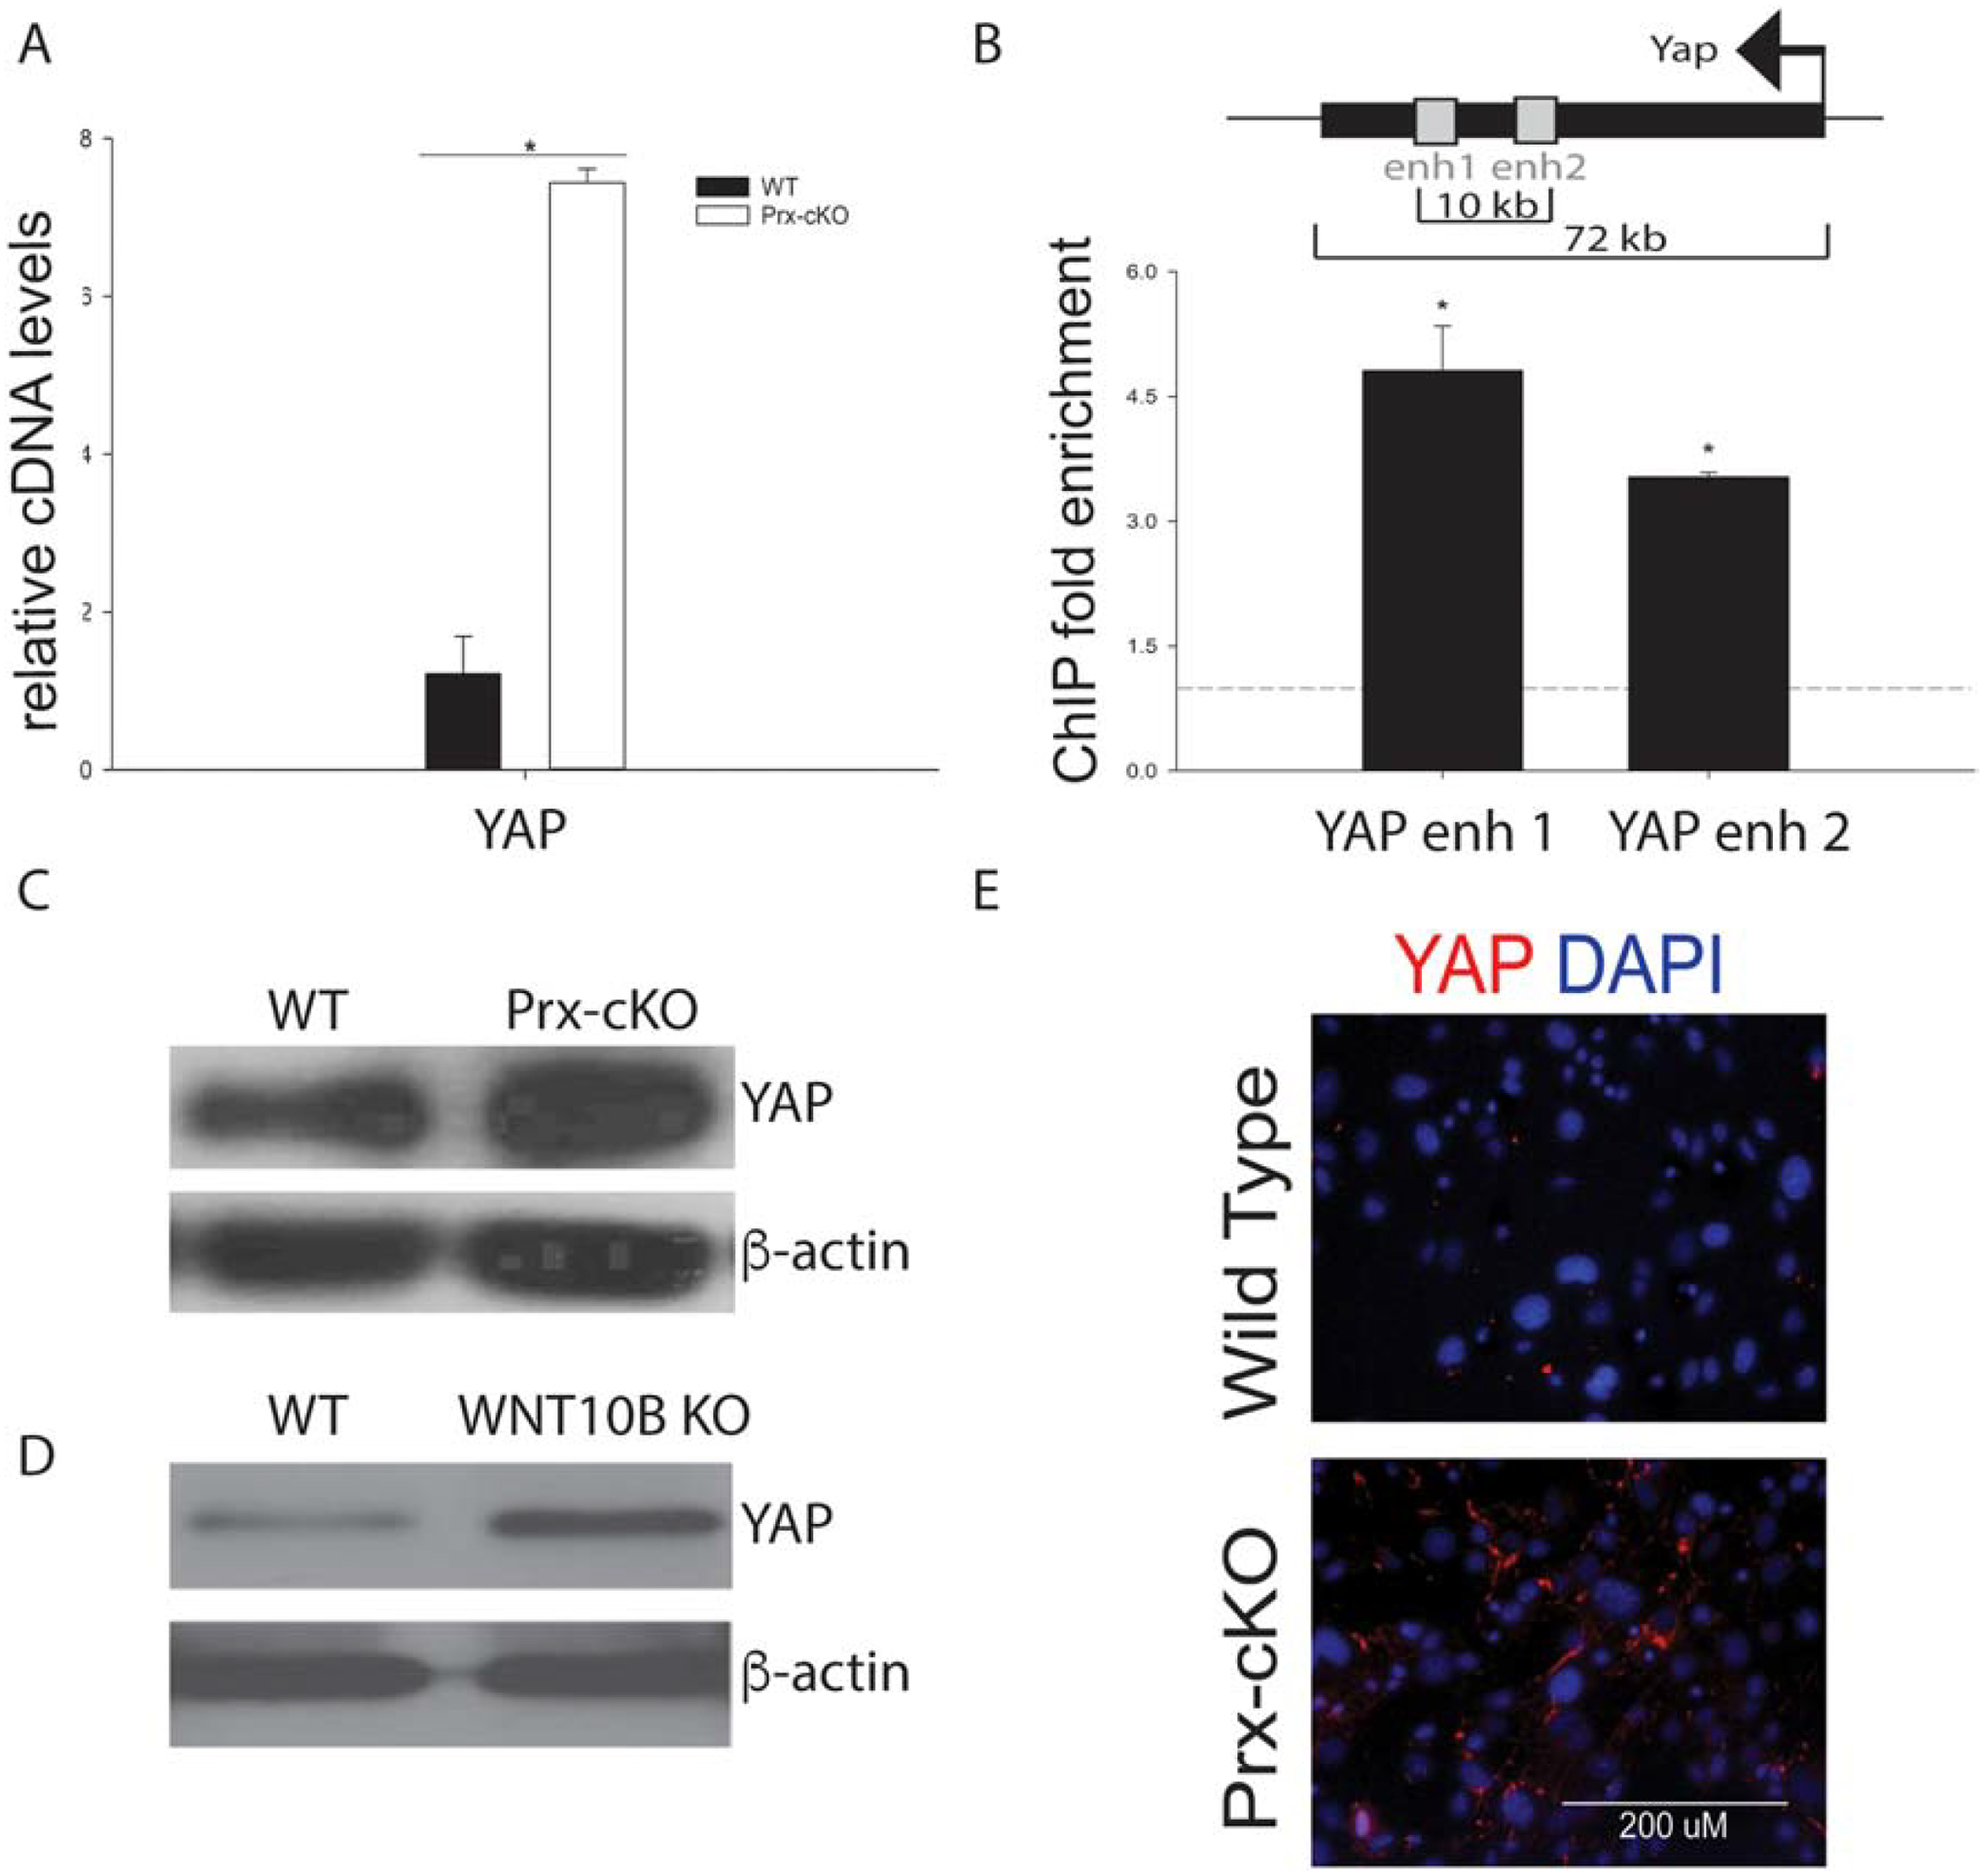
Figure 7: GATA4 directly represses YAP expression in MSCs.

(A) Bone marrow cells from WT and Gata4 Prx-cKO mice were cultured in MesenCult media. YAP cDNA expression levels were analyzed by qPCR in undifferentiated cells from WT and Gata4 Prx-cKO. (B) Chromatin immunoprecipitation was performed at the indicated enhancers or promoters. Streptavidin-coated beads were used to precipitate Flag-biotin-GATA4. qPCR was performed with primers to the indicated regions (gray boxes). Each PCR was normalized to input and represented as fold enrichment over a negative genomic locus (dotted line). Inset shows a schematic of the genomic region. The black bar indicates the YAP gene with the arrow indicating the start and direction of transcription. Gray boxes indicate intronic enhancer regions. Student’s t test; * P < 0.05; compared with a negative genomic locus. (C) Immunoblot for YAP and beta-actin from WT and Prx-cKO bone marrow. (D) Immunoblot for YAP and beta-actin from WT and WNT10B KO bone marrow. (E) Bone marrow cells from WT and Gata4 Prx-cKO mice were cultured in MesenCult media. Cells were fixed and stained with an antibody to YAP (red). Nuclei were identified with DAPI (blue).
