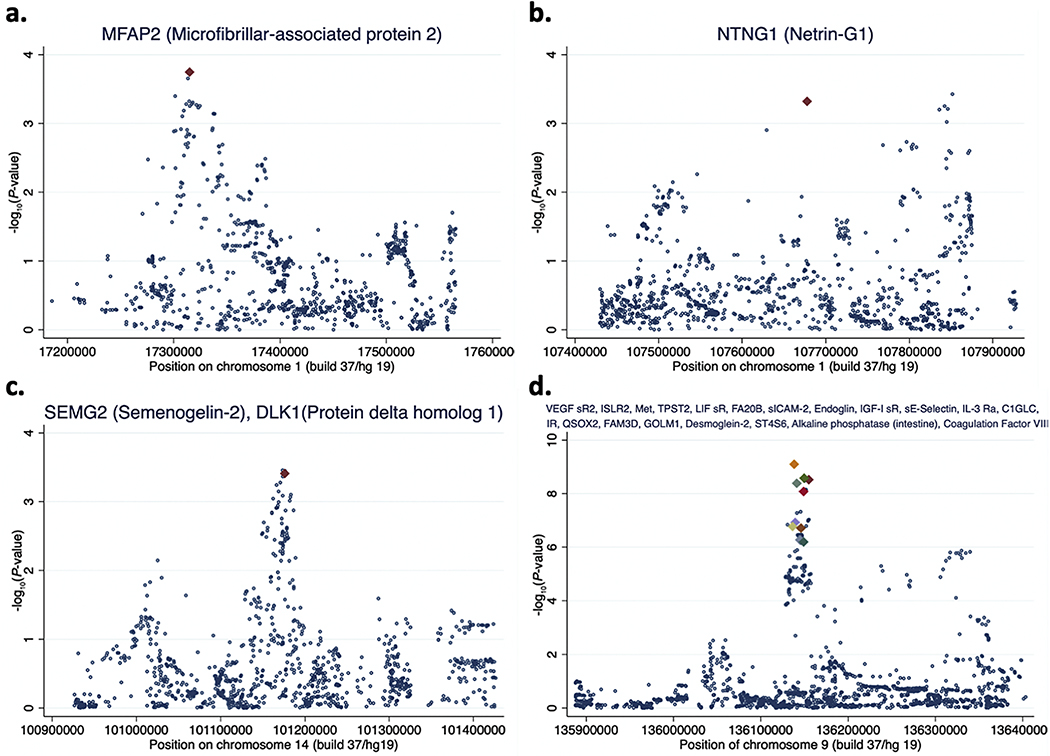
Fig. 1.
Regional genetic association plots. Genetic association with all invasive epithelial ovarian cancer risk (negative logarithm base 10 P-value) from the Ovarian Cancer Association Consortium study is plotted on the Y-axis and chromosomal position (build 37/hg 19) is plotted on the X-axis. SNPs are marked with blue dots or colored diamonds. SNPs marked with colored diamonds are the SNPs most strongly associated in the INTERVAL study with circulating (plasma) levels of the proteins named in the titles of the plots.

