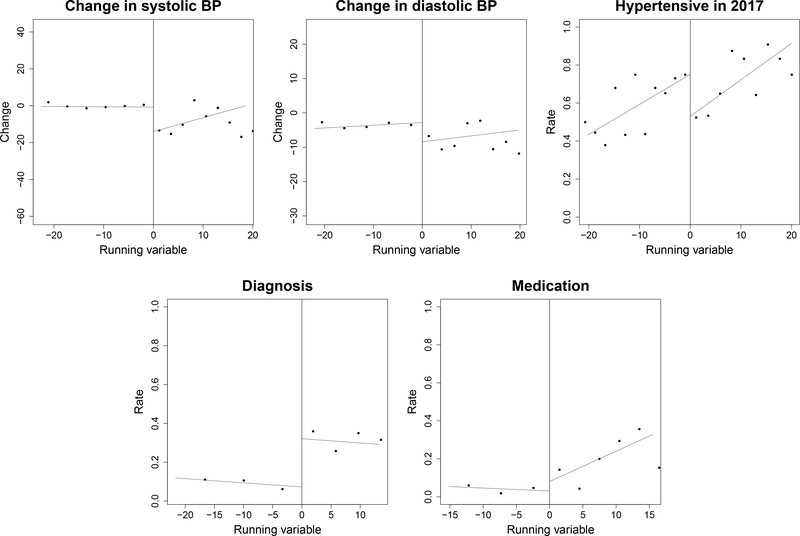
Figure 3: RDD estimates—Effects of receiving a referral letter on 2013–17 changes in blood pressure, on probability of being hypertensive, diagnosed with hypertension, or treated for hypertension in 2017.
Notes: The graphs show average blood pressure outcomes conditional on the maximum systolic blood pressure in 2013. Individuals located to the right of the vertical line received the referral card in 2013. The outcome in the top-left graph represent the average changes in systolic blood pressure from 2013 to 2017. The outcome in the top-middle graph is the average changes in diastolic blood pressure from 2013 to 2017. In the top-right graph, we define someone as being hypertensive if the mean of the three systolic or diastolic blood pressure measurements was greater or equal to 140 and 90, respectively. The outcome in the bottom-left graph is whether individuals got diagnosed by a medical professional in the two years prior to 2017. The outcome in the bottom-right graph is whether individuals are currently taking medication during the follow-up survey in 2017. We employed Mean Square Error (MSE) optimal bandwidth selector and generated the plots above using first order local-polynomial and triangular kernels. Bins are derived optimally using variance evenly-spaced method using spacing estimators (Calonico et al. 2014a,b, 2015, 2017). Each dot represents the means of the respective outcome in a given bin.

