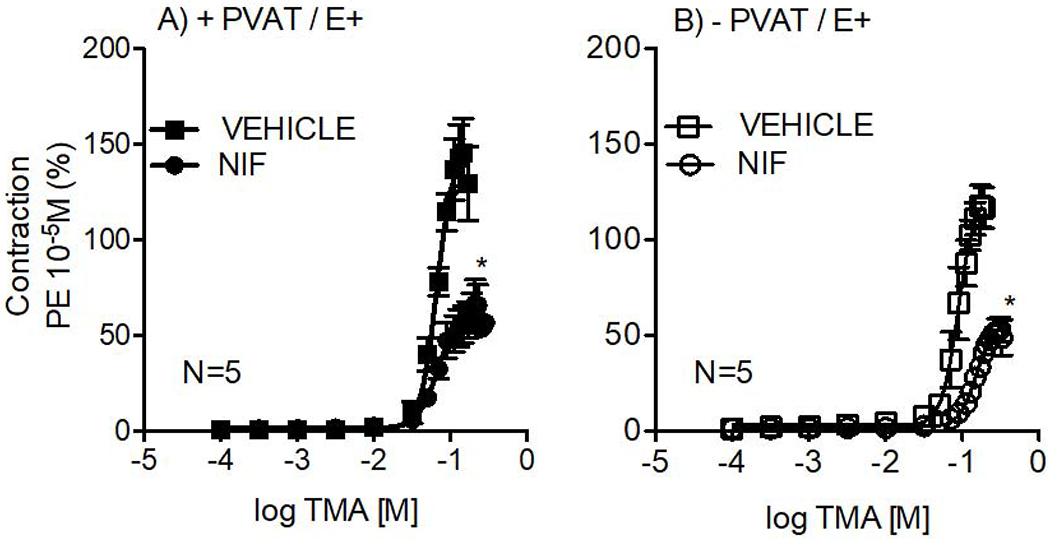
Figure 4.

Contractile concentration-response curves to TMA in the thoracic aortic rings with intact endothelium (E+) in +PVAT (A) and − PVAT (B) after 1-hour incubation with vehicle or nifedipine (NIF 0.1 μM). Points represent means ± SEM obtained as a percentage of the maximum contraction induced by 10 μM PE for the number (N) of animals indicated in the graphs. *p<0.05, Two-way ANOVA.
