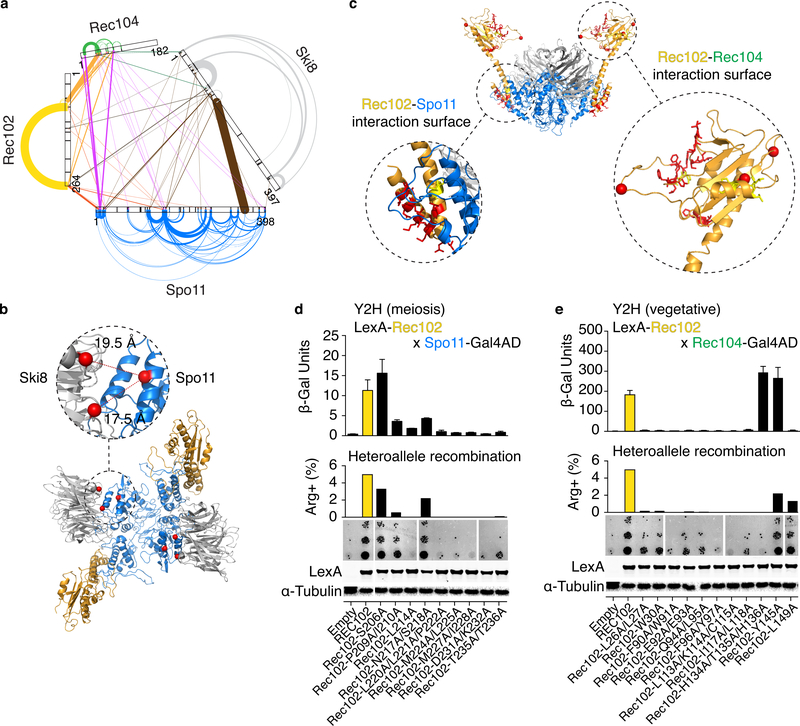
Fig. 2: Protein-protein interactions within the core complex.
a. XL-MS of the core complex. Arches and lines represent intramolecular and intermolecular crosslinks, respectively. Line width is proportional to the number of independent crosslinked peptides and is a proxy for crosslinking frequency.
b. Intermolecular crosslinks between Spo11 and Ski8. Distances between α-carbons (red spheres) of crosslinked lysines are shown.
c. Positions of mutated residues (red) at predicted interaction surfaces between Rec102 and Spo11 (left), or Rec102 and Rec104 (right). Red spheres are α-carbons of Rec102 lysines that crosslink with Rec104.
d, e. Quantitative β-galactosidase assays to measure yeast-two-hybrid (Y2H) interactions in meiotic or vegetative conditions (mean ± SD from four replicates). Center: Complementation of the meiotic recombination defect in a rec102 null mutant background. The graph shows the frequency of Arg+ prototrophs generated by recombination between two different arg4 mutant alleles; the image shows examples of growth of 5-fold serial dilutions of meiotic cultures spotted onto medium lacking arginine. Bottom: anti-LexA western blotting with α-tubulin as loading control. Data for empty vector and wild-type Rec102 are duplicated in d, e to aid comparison. Uncropped blot images and data for graphs are provided as Source Data.

