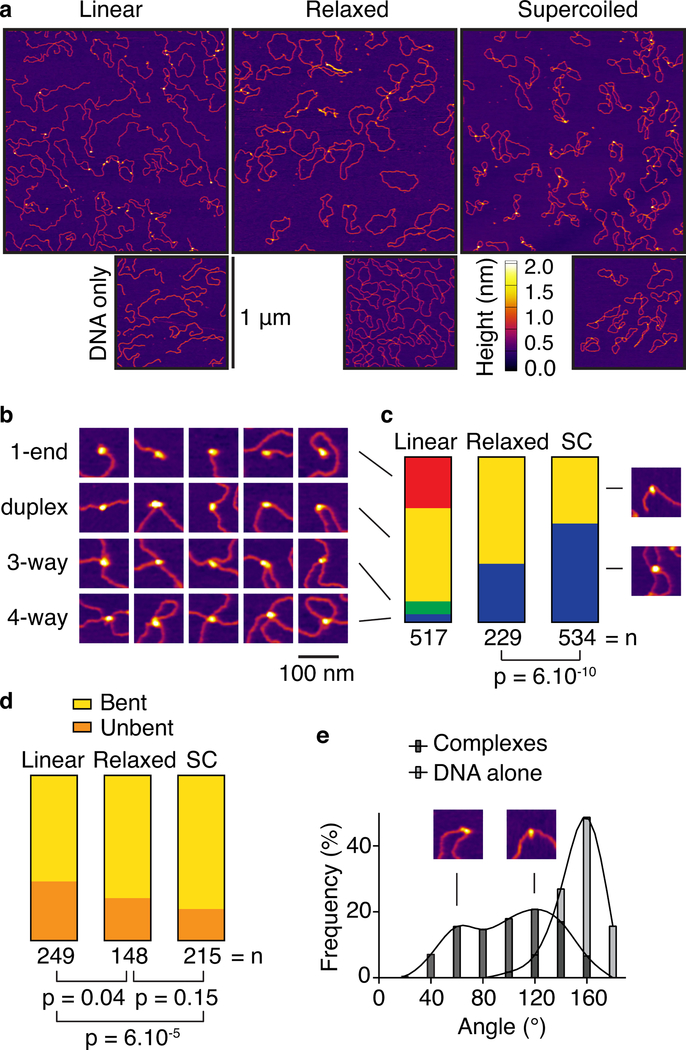
Fig. 3: DNA-binding by the core complex analyzed by AFM.
a. Wide-field views of core complexes bound to pUC19 plasmids.
b. Examples of binding to ends (1-end), internally on duplex DNA (duplex), junctions of three DNA arms (3-way), and junctions with four DNA arms (4-way).
c. Quantification of DNA-bound particles with the three substrates assayed. SC, supercoiled.
d. Fractions of duplex-bound particles that exhibited DNA bending.
e. Histogram of bending angles (n = 212 particles). Angles at randomly chosen positions along the DNA are shown as a control (n = 115 particles).
P values in c, d are from two-sided Fisher’s exact tests.
Data for graphs in c, d, e are provided as Source Data.

