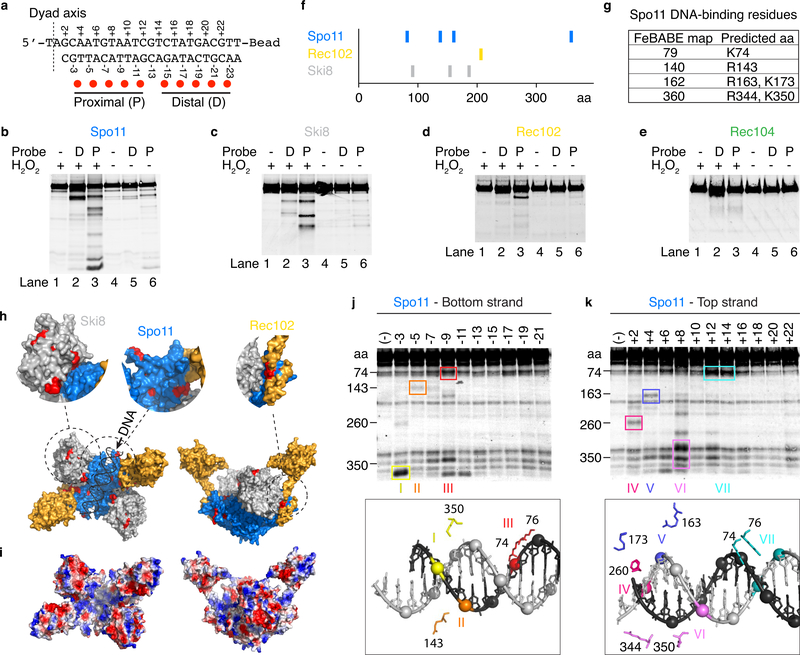
Fig. 5: Mapping DNA-binding surfaces by hydroxyl radical footprinting.
a. Sequence of the DNA substrate and positions of FeBABE moieties (red dots). The dyad axis is the center of rotational symmetry of Spo11 DSBs.
b–e. Hydroxyl radical cleavage of core complexes carrying a C-terminal Flag tag on Spo11 (b), Ski8 (c), or Rec104 (e), or an N-terminal tag on Rec102 (d). Asterisks in panel b indicate cleavage positions illustrated in panel f.
f. Summary of hydroxyl radical cleavages.
g. Estimated cleavage positions in Spo11 and corresponding predicted DNA-binding residues.
h. Hydroxyl radical cleavage sites (red) highlighted on the model of the core complex.
i. Electrostatic potential map of the core complex model.
j, k. Hydroxyl radical cleavage of tagged Spo11 using probes labeled at single positions along either the bottom (j) or top (k) strands. Prominent cleavage positions are color-coded (roman numerals) and highlighted on the structural model of the end-bound complex (below) to show the spatial correlation with positions of FeBABE-modified phosphates. Some minor cleavage positions were omitted for simplicity. Non-specific degradation fragments were also observed, some of which comigrate with bone fide FeBABE-dependent fragments because cleaved positions tend to be surface-exposed.
Uncropped blot images for panels b-e, j, k are provided as Source Data.

