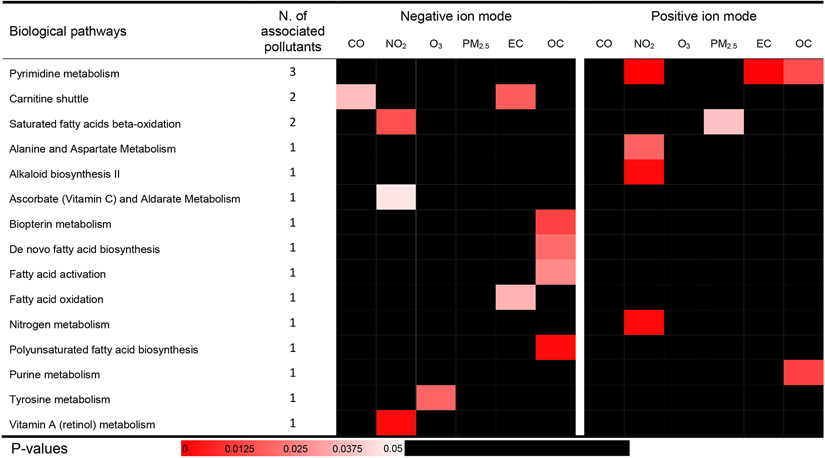
Figure 2. Metabolic pathways associated with 1-day lag pollution from Tobit models.
Cells are shaded according to the magnitude of p-values generated by mummichog for each pathway. Pathways enriched by more than 2 annotated significant metabolic features were included and ordered alphabetically and following the total number of the significant associations between pathways and pollutants by either negative or positive ion modes.

