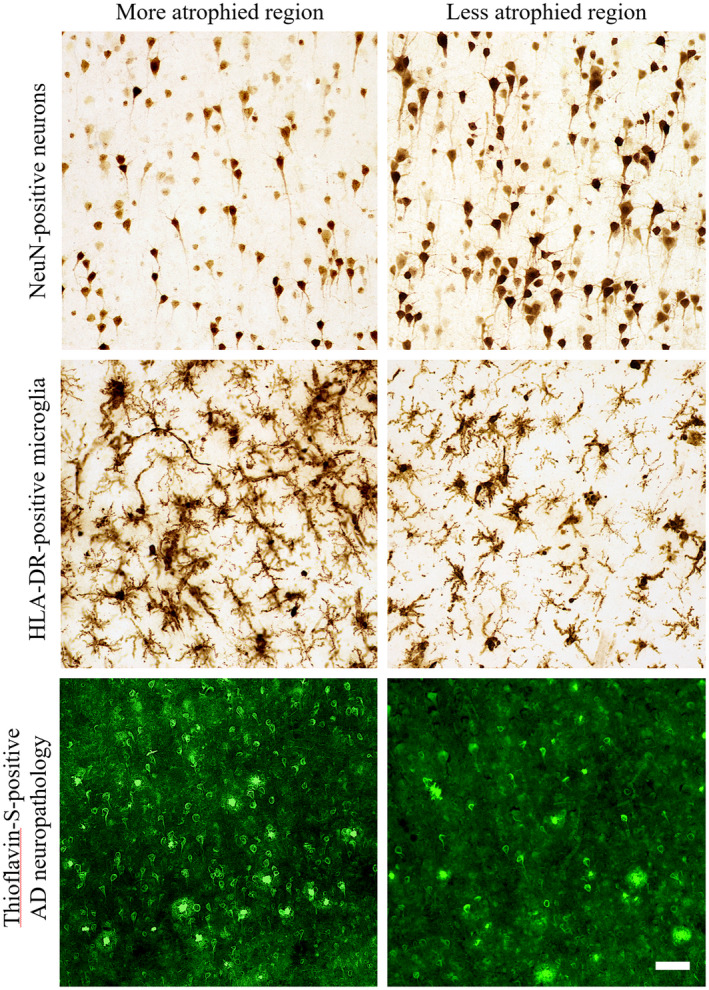
Figure 2.

Representative photomicrographs of the differential distributions of neurons, activated microglia, and AD neuropathology in regions with high or low cortical atrophy in a PPA‐AD participant. More atrophied regions often displayed lower densities of NeuN‐positive neurons and higher densities of HLA‐DR‐positive activated microglia and Thioflavin‐S‐positive NFTs in comparison to less atrophied regions. Photomicrographs of each marker were acquired at 20× magnification and centered over cortical layer III within the gyral crown of bilateral aIPL in PPA‐AD participant #3. More atrophied region—left aIPL; less atrophied region—right aIPL. Scale bar set to 50 µm.
